Per-region statistics
In addition to the summary report, you can see coverage statistics for each
targeted region. This is reported as a track, and you can see the numbers by
going to the table (![]() ) view of the track. An example is shown in figure 26.7:
) view of the track. An example is shown in figure 26.7:
- Chromosome The name is taken from the reference sequence used for mapping.
- Region The targeted region.
- Name The annotation name derived from the annotation (if there is additional information on the annotation, this is retained in this table as well).
- Target region length The length of the region.
- Target region length with coverage above... The length of the region that is covered by at least the Minimum coverage.
- Percentage with coverage above... The percentage of the positions in the region with coverage at least the Minimum coverage.
- Read count Number of reads that cover this region. Note that reads that only cover the region partially are also included. Note that reads in overlapping pairs are counted individually (see figures 26.7 and figure 26.8).
- Base count The number of bases in the reads that are covering the target region. Note that bases in overlapping pairs are counted only once (see figures 26.7 and figure 26.8).
- %GC The GC content of the region.
- Min, Max, Mean and Median coverage Lowest, highest, average and median coverage in the region, respectively.
- Zero coverage bases Number of positions with no coverage.
- Mean and median coverage (excluding zero coverage) The average and median coverage in the region, excluding any zero-coverage parts.
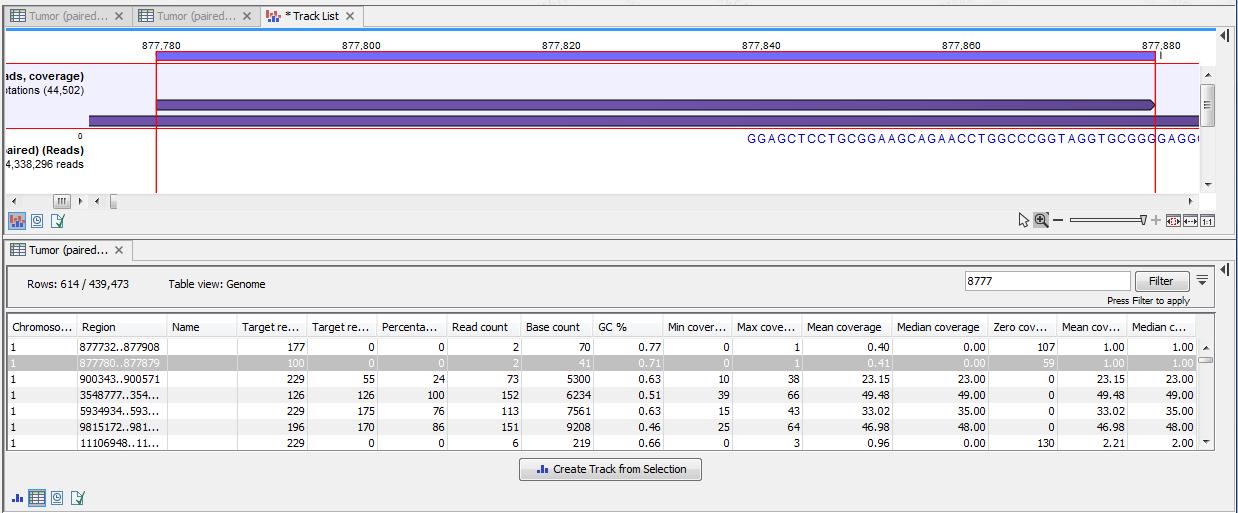
Figure 26.7: A track list containing the target region coverage track and reads track. The target region coverage track has been opened from the track list and is shown in table view. Detailed information on each region is displayed. Only one paired read maps to the region selected.
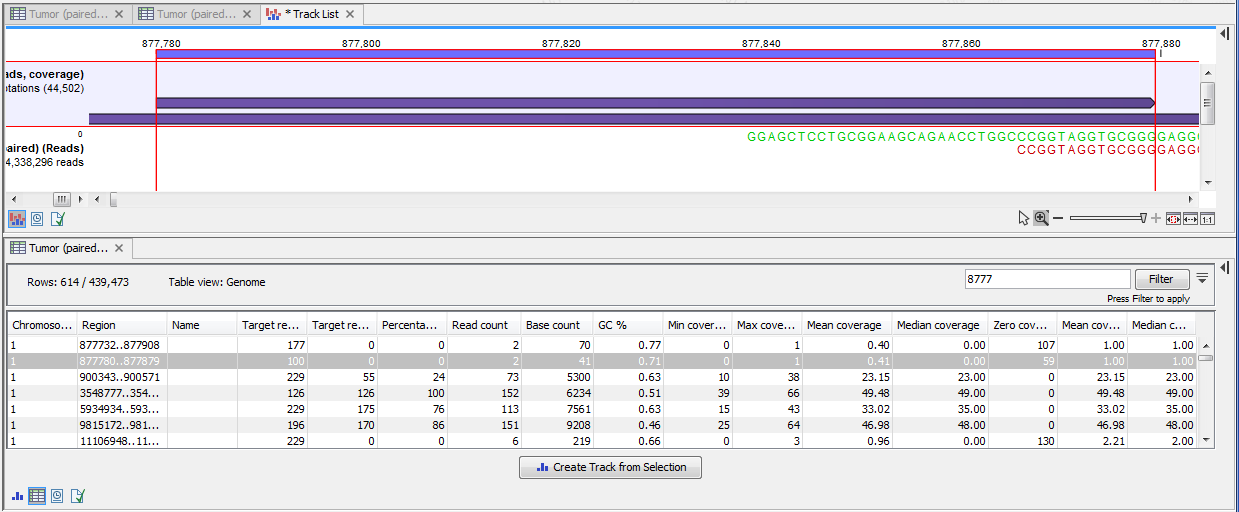
Figure 26.8: The same data as shown in figure 26.7, but now the Disconnect paired reads option in the side-panel of the reads track has been ticked, so that the two reads in the paired read are shown disconnected.
In the shown figure, the coverage table is shown in split view with a track list. The coverage track has been opened from the track list by clicking once on the name found in the left side in the track list. When opening a read mapping in split view from a track list, the two views are linked, this means that when you click on an entry in the table, this position will be brought into focus in the track list.
For information about how to create a track list, please see track list.