Create Combined RNA-Seq Report
Create Combined RNA-Seq Report has been deprecated and will be retired in a future version of the software. Please use the Combine Reports tool instead.
Create Combined RNA-Seq Report has been moved to the Legacy Tools (![]() ) folder of the Toolbox, and its name has "(legacy)" appended to it. If you have concerns about the future retirement of this tool, please contact QIAGEN Bioinformatics Support team at ts-bioinformatics@qiagen.com.
) folder of the Toolbox, and its name has "(legacy)" appended to it. If you have concerns about the future retirement of this tool, please contact QIAGEN Bioinformatics Support team at ts-bioinformatics@qiagen.com.
With the Create Combined RNA-Seq Report tool, you can generate an overview of several RNA-seq experiments by combining in one document several RNA-Seq reports. The description of the various sections included in the report, as well as the cutoff values that trigger warnings for sub-optimal data are the same as described for RNA-Seq reports (see RNA-seq reports). The combined report can be exported in PDF or Excel format.
To start the tool:
Toolbox | Legacy Tools (![]() ) | Create Combined RNA-Seq Report (
) | Create Combined RNA-Seq Report (![]() )
)
In the wizard that opens (figure 35.6), select several RNA-seq reports and click Next. Note that while it seems possible to select any kind of reports in that dialog, only RNA-seq reports generated by CLC Genomics Workbench 20.0.4 or higher will be compiled in the combined RNA-seq report.
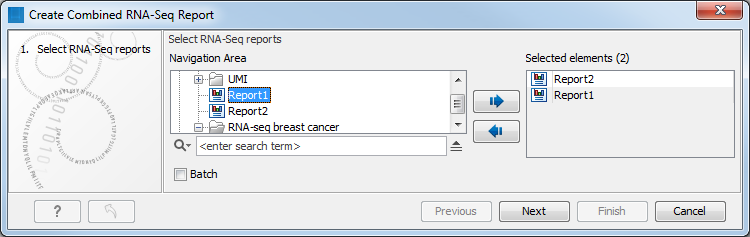
Figure 35.6: The Create Combined RNA-Seq Report tool.
In the Result handling window, choose whether you want to Open or Save the combined report. When saving, specify where you would like to save the combined report in the Navigation Area, and click Finish.
The results of the individual reports are compiled in tables, and organized in the same sections than the ones were present in the individual input reports. This layout enables a quick overview of a series of experiments as well as the different troubleshooting options for dealing with sub-optimal data quality (see figure 35.7 for an example of the first four sections of a combined report).
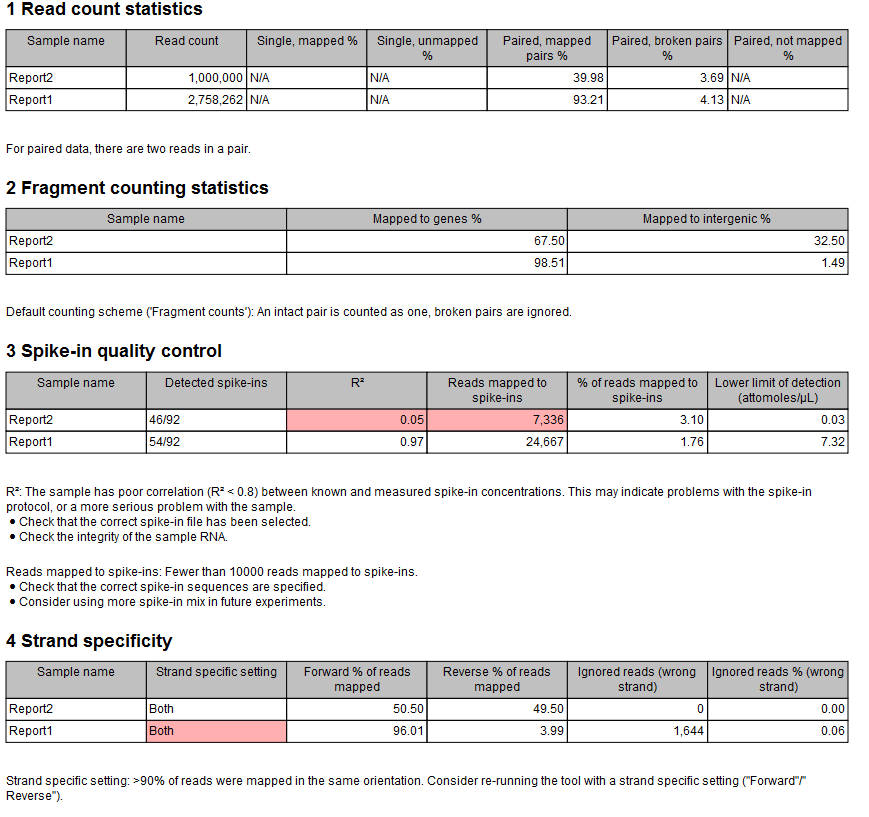
Figure 35.7: An example combined report with pink highlights where data is of sub-optimal quality.