Gene fusion reporting
When using paired data, there is also an option to create an annotation track summarizing the evidence for gene fusions. An example is shown in figure 30.19.
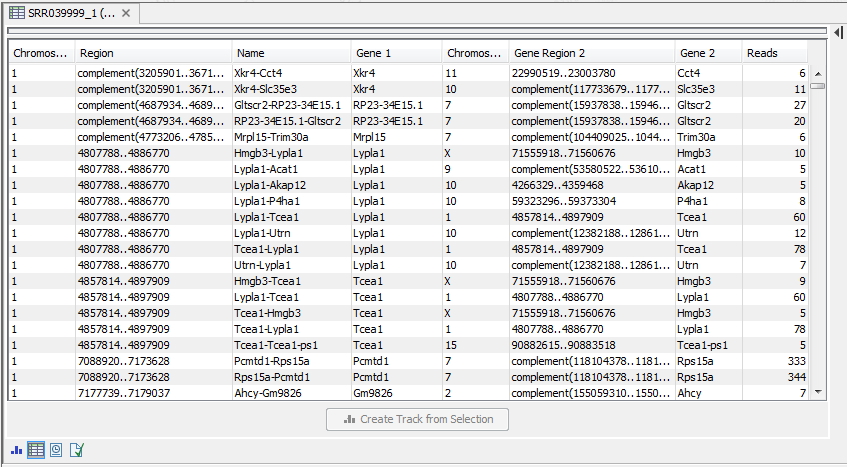
Figure 30.19: An example of a gene fusion table.
Each row represents one gene where read pairs suggest it could be fused with another gene. This means that each fusion is represented by two rows.
The Minimum read count option in figure 30.9 is used to make sure that only combinations of genes supported by at least this number of read pairs are included. The default value is 5, which means that at least 5 pairs need to connect two genes in order to report it in the result.
The result table shows the following information for each row:
- Name. The name of the fusion (the two gene names combined).
- Information per gene. Gene name, chromosome and position are included for both genes.
- Reads. How many reads that are mapped across the two genes.
File | New | Track List (![]() )
)