Call Methylation Levels
The tool takes as input one or more read mappings created by the Map Bisulfite Reads to Reference tool. If more than one mapping is used as input, various statistical options to detect differential methylation become available.
The tool will accept a regular mapping as input, but will warn about possibly inconsistent interpretation of results. Mapping done in a 'normal', not bisulfite mode, is likely to result in sub-optimal placement of reads due to a large number of C/T mismatches between bisulfite-converted reads and a reference. Also, this tool will consequently interpret majority of cytosines in a reference as methylated, creating possibly very large and misleading output files. The invisible 'bisulfite' property of a mapping may be erased if the original mapping is manipulated in the workbench with other tools - such as the Merge Read Mappings tool - in which case the warning should be ignored.
After selecting the relevant mapping(s), the wizard offers to set the parameters for base-level methylation calling, as shown in figure 33.27:
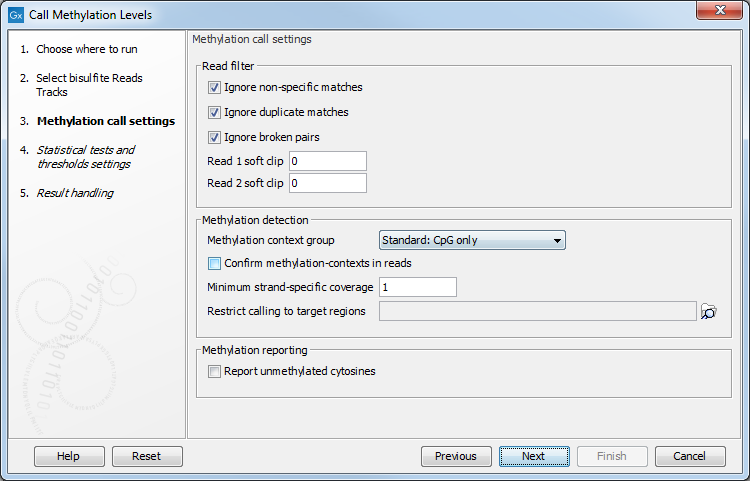
Figure 33.27: Methylation call settings.
- The first three check boxes (Ignore non-specific matches, Ignore duplicate matches, Ignore broken pairs) enable control over whether or not certain reads will be included in base level methylation calling, and subsequent statistical analysis. The recommended option is to have them turned on.
- Ignore non-specific matches Reads or matches mapped ambiguously will be ignored.
- Ignore duplicate matches Multiple reads with identical mapping coordinates will be counted once only.
- Ignore broken pairs Pairs reads mapped as broken pairs will be ignored.
- Read 1 soft clip, Read 2 soft clip: sets a number of bases on a 5'-end of a read that will be ignored in methylation calling. It is common for bisulfite data to have a technical bias in amplification and sequencing, making a small number of bases at the beginning of a read (usually not more than 5) unreliable for calling. Setting a parameter to 0 (default), and inspecting a graph in the report may help determine the specific number for a certain dataset, if a bias is suspected.
- Methylation context group popup menu controls in which context the calls will be made.
- Standard contexts include:
CpG Detects 5-methylated cytosines in CpG contexts
CHG Detects 5-methylated cytosines in CHG contexts (H = A/C/T)
CHH Detects 5-methylated cytosines in CHH contexts
- NOMe-seq contexts [Kelly et al., 2012] include:
GCH Detects enzymatic methylation in GCH contexts
HCG Detects endogenous methylation in HCG contexts
GCG Detects ambiguous methylation in GCG contexts
- Exhaustive
Detects 5-methylated cytosines independently of their nucleotide-context
- Standard contexts include:
- Confirm methylation contexts in reads checkbox controls if a selected context(s) is present in a read itself, and not just a reference sequence, before a call is made. This is useful if a sample has a variant that can affect a context of a call, so that reads representing a variant allele that breaks a context will be excluded, if the box is checked.
- Minimum strand-specific coverage sets a lower limit of coverage for the top, or a bottom strand, to filter out positions with low coverage.
- Restrict calling to target regions enables selection of a feature track to limit calling to defined regions. In addition to genes, CDSs and other annotation tracks that can be generated or imported into the workbench, the tool Create RRBS-fragment Track tool can be used to generate fragments of pre-selected size predicted for restriction digest of a reference genome with commonly used frequent cutters that target common methylation contexts, such as MspI.
- Report unmethylated cytosines ensures that methylation levels are reported at all sites with coverage, rather than sites with some methylation. Both methylated and unmethylated cytosines will be reported in the optional methylation levels track, while the detection of differentially methylated regions remains unaffected. With this option on, the methylation levels track will include some fully unmethylated cytosines with "methylation level = 0" and "methylated coverage = 0", provided that they have context coverage >=1.
Statistical tests and thresholds settings
The next set of parameters depends on experimental setup, and a number of samples in the input, as shown in 33.28.
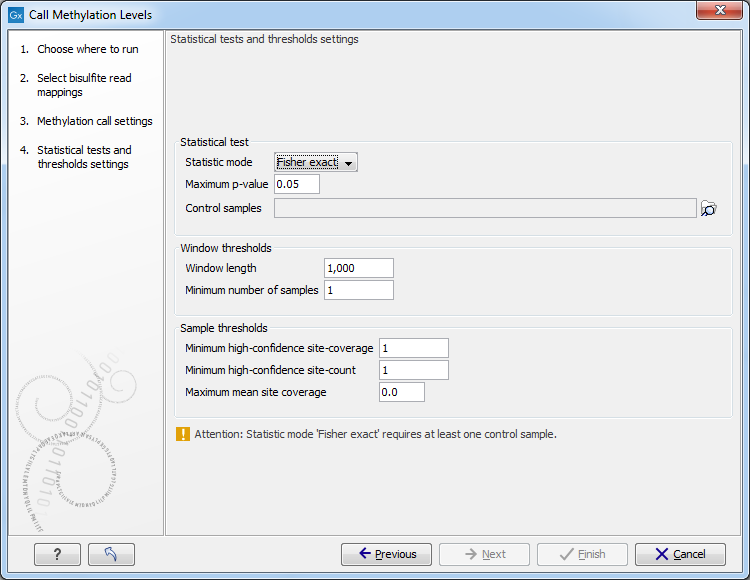
Figure 33.28: The statistical tests and thresholds settings.
Statistical test
- Statistic mode pop-up menu offers the following choices.
- Fisher exact: Compares methylation-levels of a case/control sample-pair; multiple case/control samples are merged before pair-wise comparison. Context-specific coverage, and methylated coverage are summed separately for case and control mappings in a window of pre-set size. If more than one case, or control samples are provided, the values within each set are simply added. The contingency table is used to evaluate the hypergeometric cumulative distribution probability for methylated coverage in case sample(s) to be equal or greater than in controls, given the context-specific coverage in a window. Therefore, this test reports statistically significant HYPER-methylation in cases, compared to controls, in a given window. To identify regions that are hypo-methylated compared to controls with this test, simply reverse case and control when specifying the inputs.
- Chi-squared: Analyses the inter-individual methylation-level variability across a cohort of samples; no controls are supported. A contingency table is constructed for a window, where each row corresponds to an input sample, with coverage counted for methylated and unmethylated cytosines within strand/context. Expected values for those, given sample coverage in a window, are calculated from aggregate for all samples, and deviation is evaluated with a Chi-squared test. This statistic tells if an input group of samples has methylation heterogeneity between them, in a given window.
- ANOVA: Assesses differential methylation by comparing a case-sample group versus a control-sample group; requires at least two case-samples and two control-samples. It tests if variability in methylation levels within each group is less than between groups, in a window of interest.
- No test: No test will be performed and only methylation levels will be produced for each input sample; remaining options on that screen will be grayed out.
- Maximum p-value sets the limit of probability calculated in a statistical test of choice, at which a window will be accepted as significant, and included in the output.
- Control samples menu is used to select bisulfite mappings that are required to serve as controls in either Fisher exact, or Anova statistics.
Window thresholds
- Window length
When no window track was chosen in the previous step for focusing the analysis, examine differential methylation in windows of this fixed size. Defines the size of the window in the genome track within which methylation levels in case and control samples are compared, and statistical significance of difference, if any, is calculated and reported. Windows are evaluated sequentially along the reference.
- Minimum number of samples A window will be skipped, if less than this number of samples in a group have coverage at or above the Minimum strand-specific coverage in a minimum number of sites, as defined below.
Sample thresholds
- Minimum high-confidence site-coverage
A site with at least this coverage is considered a high confidence site.
- Minimum high-confidence site-count
Exclude sample from a current window, if it has fewer than this number high-confidence methylation-sites.
- Maximum mean site coverage Exclude sample from current window, if it has a higher mean site coverage. The default "0.0" setting does not filter any.
The tool produces a number of feature tracks and reports. Select the outputs you are interested in during the last wizard step of the tool. The Create track of methylated cytosines option is chosen by default. It will provide a base level methylation track for each read mapping supplied, i.e., case or control (see figure 33.29 for a table view of the track).
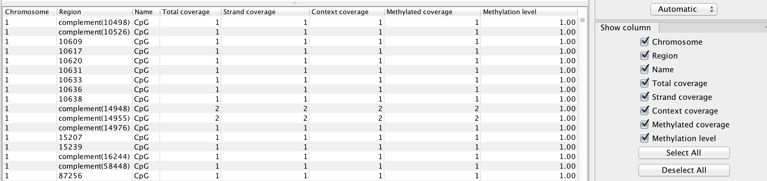
In the table, each row corresponds to a cytosine that conforms to a context (such as 'CpG' in this example) and which has non-zero methylated coverage.
The columns of the methylation levels track table view indicate:
- Chromosome chromosome in which the methylated cytosine is found
- Region position of the mapping where the methylated cytosine is found. Rows with 'Region' values that start with 'complement' represent methylated Cs in reads that come from the original bottom strand of reference.
- Name of the context in which methylation is detected (see tooltip of the wizard for the names and definition of the various contexts available.)
- Total coverage total reads coverage of the position. May be calculated after filtering for non-specific, broken, and duplicate reads if these options are enabled.
- Strand coverage of the total coverage, how many reads are in the same direction than the strand in which the methylated C is Fdetected (original top, or original bottom)
- Context coverage of the strand coverage, how many reads conform to the selected methylation context
- Methylated coverage how many reads support evidence of methylation in this position, i.e., retained Cs instead of conversion to Ts
- Methylation level "Methylated coverage" divided by "Context coverage"
For each mapping, you can also generate an optional summary report by selecting the Create methylation reports option. This report includes statistics of direction of mapping of reads/read pairs, chosen contexts, and useful graphs. The graphs can help detect any bias in called methylation levels that commonly occurs at the start of BS-seq reads due to end-repair of DNA fragments in library preparation. This facilitates setting the correct trimming parameters for Read 1 soft clip, Read 2 soft clip.
Note that positions where no methylation was detected are filtered from the final output and are not reported in the 'Methylation levels' feature track. However they are included in the intermediate calculations for differential methylation detection.
When the statistical test is performed, a feature track is produced. If more than one methylation context is chosen, a separate feature track is produced for each individual context, i.e., for CpG, CHH, etc. The table view of such track for Fisher exact test is shown in figure 33.30.
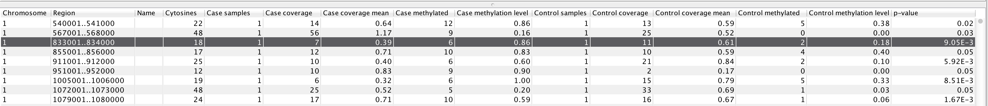
Figure 33.30: Example of table with statistical test output.
The columns of the differential methylation feature track table indicate:
- Name column not used
- Cytosines total number of cytosines in the region
- Case samples number of samples in the case group
- Case coverage sum of "Total coverage" values of the region in the case group
- Case coverage mean sum of "Context coverage" in the region divided by the number of covered Cs in context in the region in the case group
- Case methylated sum of "Methylated coverage" in the region in the case group
- Case methylation level "Case methylated" divided by "Case coverage mean"
- Control samples number of samples in the control group
- Control coverage sum of "Total coverage" values of the region in the control group
- Control coverage mean sum of "Context coverage" in the region divided by the number of covered Cs in context in the region in the control group
- Control methylated sum of "Methylated coverage" in the region in the control group
- Control methylation level "Case methylated" divided by "Case coverage mean" for the control group
- p-value probability of no difference in methylation levels between case and control in the region, given the data and the statistical test applied
For the highlighted window region 833001..834000, the relevant values used in the hypergeometric test are 6 (the number of methylated cytosines in the case sample) out of 7 (total number of cytosines), while the control sample had 11 covered context-conforming cytosines in the region, of which only 2 were methylated. If there are no case/control difference in methylation, the probability (p-value) of such hypermethylation in the case sample is calculated as
![]() , below the threshold.
, below the threshold.