Organization of the experiment table
The resulting experiment(created using Set up experiment) includes all the expression values and other information from the samples (the values are copied - the original samples are not affected and can thus be deleted with no effect on the experiment). In addition it includes a number of summaries of the values across all, or a subset of, the samples for each feature. Which values are included is described in the sections below.
When you open it, it is shown in the experiment table (see figure 31.5).
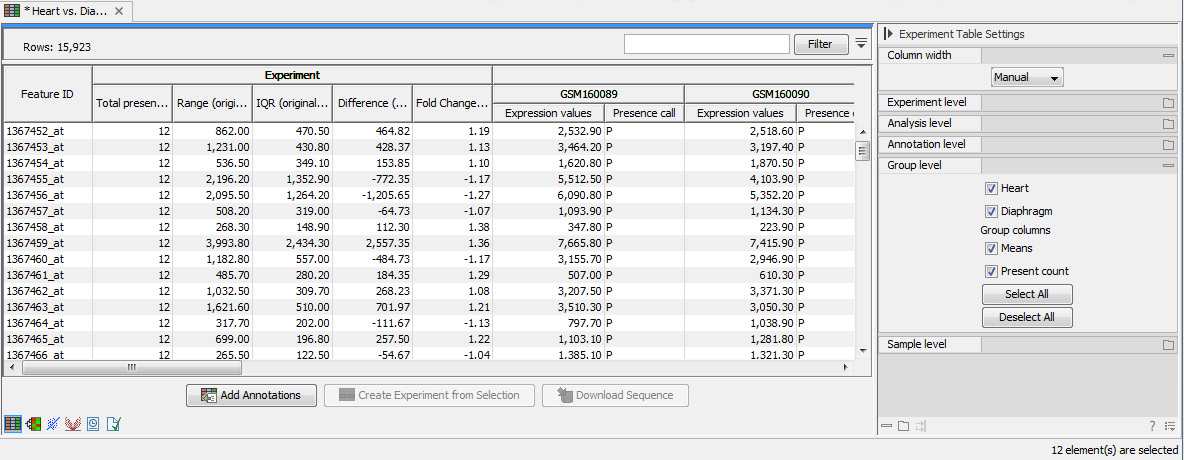
Figure 31.5: Opening the experiment.
For a general introduction to table features like sorting and filtering, see Working with tables.
Unlike other tables in CLC Genomics Workbench, the experiment table has a hierarchical grouping of the columns. This is done to reflect the structure of the data in the experiment. The Side Panel is divided into a number of groups corresponding to the structure of the table. These are described below. Note that you can customize and save the settings of the Side Panel.
Whenever you perform analyses like normalization, transformation, statistical analysis etc, new columns will be added to the experiment. You can at any time Export (![]() ) all the data in the experiment in csv or Excel format or Copy (
) all the data in the experiment in csv or Excel format or Copy (![]() ) the full table or parts of it.
) the full table or parts of it.
Subsections
- Column width
- Experiment level
- Analysis level
- Annotation level
- Group level
- Sample level
- Creating a sub-experiment from a selection
- Downloading sequences from the experiment table