Venn diagram table view
It is possible to inspect the p-values and fold changes for each gene or transcript individually in the Venn diagram table view (see figure 30.39).
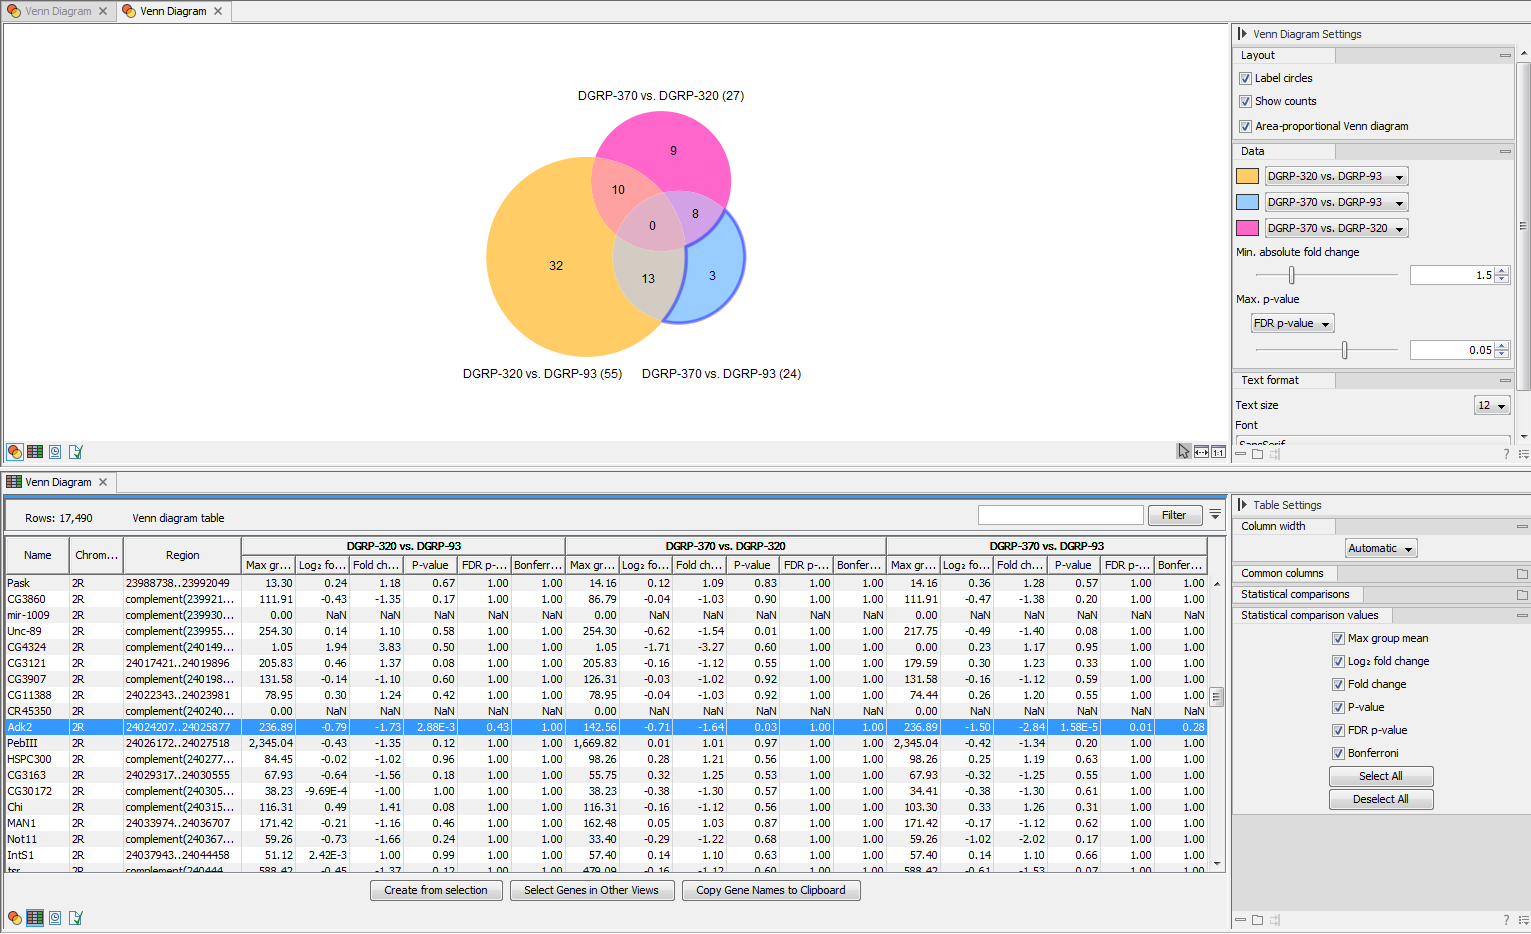
Figure 30.39: The Venn diagram table view.
Clicking a circle segment in the Venn Diagram plot will select the genes or transcript in the table view. You can then use the "Filter to selection" button in the Table view to only see the selected rows. It is also possible to create a subset list of genes or transcripts using the Create from selection.
In the Side Panel to the right it is possible to adjust the Table settings. It is possible to adjust the column layout, and select which columns should be included in the table.