Track types
The different track types in the CLC Genomics Workbench are:
- Sequence Track (
 )
) - A sequence track contains one or more sequences and is usually used to store the reference sequences of a genome (e.g. the chromosomes or the consensus sequences of de novo assembled contigs).
- Reads Track (
 )
) - Reads Tracks hold read mappings such as the ones produced by the Map Reads to Reference, Local Realignment or RNA-Seq Analysis tools. The reads track contains all the reads that have been mapped at their mapped positions, and you can zoom in all the way to base resolution. In case there are more reads than the height of the track allows, an overflow graph will be displayed above the reads in the same colors than the reads that it represents. When hovering over the reads, a vertical scroll bar will appear to the right of the reads to navigate through high coverage regions, and in non-aggregated view, a tooltip shows the read counts for each observed nucleotide in that position together with the directions of the reads with that nucleotide. Read more about reads tracks here: Reads tracks.
- Variant Track (
 )
) - A variant track (see Variant tracks) stores features that fulfill the requirements for being a variant. A particular requirement for being a variant is that it refers to a particular region of the reference, and it is possible to describe exactly how the sample "Allele" sequence looks in this region, as compared to what the "Reference allele" sequence looks like in this region. Variants may be of type SNV, MNV, replacement, insertion or deletion. A variant track may be produced either by running a Variant detection tool in the Workbench, or by importing a variant format file (such as a VCF or a GVF file), or by downloading it from a database (e.g. dbSNP).
Note on the InDels and Structural Variants: this tool detects structural variants, including insertions, deletions, inversions, translocations and tandem duplications. It will produce a variant track, which will contain some insertions and deletions (the "InDel" track). However, the tool will also detect some insertions for which the "Allele" sequence is not fully, but only partially, known. These insertions do not fulfill the requirements of being a variant and therefore cannot be put in the variant track. Instead they are put in the "SV track", along with the inversions and translocations. The "SV" track is an "annotation" (or "feature") track, which is less strict and more flexible in the requirements to the types of annotations (or features) that it can contain (see below).
- Annotation Track (
 )
) - Each annotation track contains a certain type of annotations. Examples are gene or mRNA tracks, UTR tracks, conservation score tracks and target region tracks. They may be obtained either by importing a BED, GTF or GFF file, or by downloading a database, such as ENSEMBL, in the workbench using the Import | Tracks tool (Import Tracks). Annotation tracks can also be downloaded with the Reference Data Manager. Also, many of the tools in the Workbench will output annotation tracks: for example, the Indels and Structural Variants tool will put the detected structural variants (that do not fulfill the requirements for being of type "variant") in an annotation track called SV track, or the ChIP-Seq detection tool which will compile the detected "peaks" into a peak annotation track. Finally, a gene (annotation) track can be created (see 24.6.1Convert to Tracks). A description of how to annotate and filter tracks is found in Annotate and filter tracks.
- Coverage Graph Track (
 )
) - The coverage graph track is calculated from a reds track and contains a graphical display of the coverage at each position in the reference.
- Expression Track (
 )
) - The RNA-seq algorithm produces expression tracks: one for genes and one for transcripts. These have an annotation for each gene or transcript, and an expression value associated to that annotation. The type of expression value associated with each annotation is determined by the expression value parameter selected in the RNA-Seq tool. These values are visualized as a color gradient from blue to red; the lowest expression value within each chromosome of the track is represented as 0% and the highest expression value within each chromosome of the track is represented by 100%.
An example of the different types of tracks is given in figure 24.2.
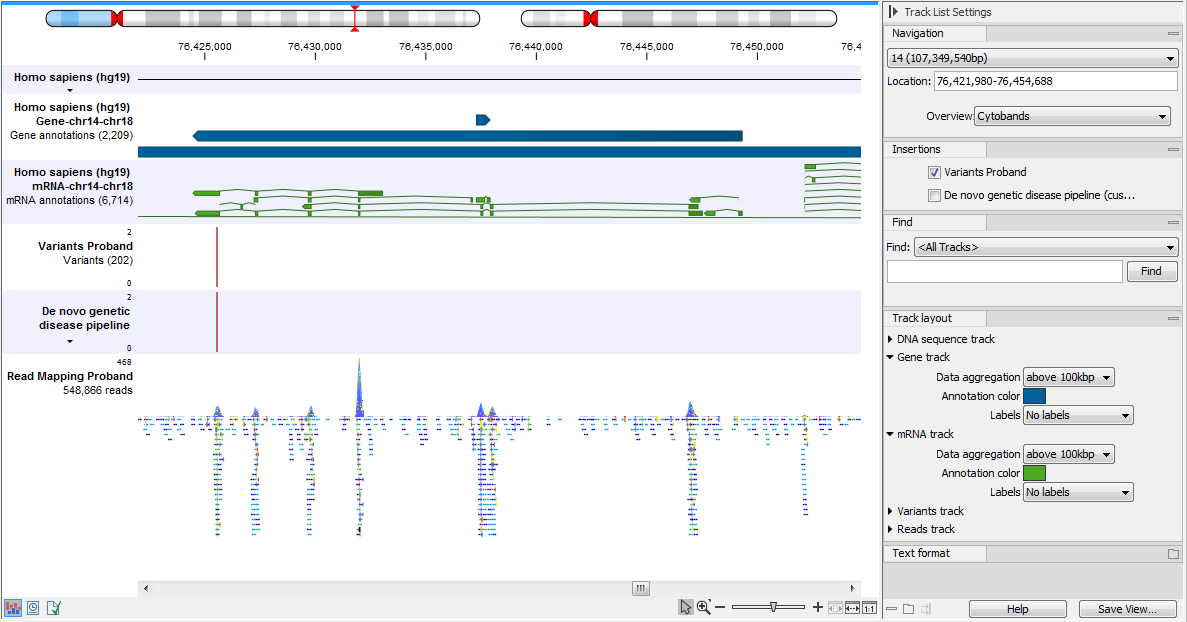
Figure 24.2: A track list containing different types of tracks. From the top: a sequence track, three annotation tracks with gene, mRNA and CDS annotations respectively, two variant tracks, a gene-level (GE) and a transcript level (TE) expression track, a coverage track and a reads track.