Hierarchical Clustering of Samples
A hierarchical clustering of samples is a tree representation of their relative similarity.
The tree structure is generated by
- letting each sample be a cluster
- calculating pairwise distances between all clusters
- joining the two closest clusters into one new cluster
- iterating 2-3 until there is only one cluster left (which will contain all samples).
(See [Eisen et al., 1998] for a classical example of application of a hierarchical clustering algorithm in microarray analysis. The example is on features rather than samples).
To start the clustering:
Toolbox | Microarray Analysis (![]() )| Quality Control (
)| Quality Control (![]() ) | Hierarchical Clustering of Samples (
) | Hierarchical Clustering of Samples (![]() )
)
Select a number of samples ( (![]() ) or (
) or (![]() )) or an experiment (
)) or an experiment (![]() ) and click Next.
) and click Next.
This will display a dialog as shown in figure 31.32. The hierarchical clustering algorithm requires that you specify a distance measure and a cluster linkage. The similarity measure is used to specify how distances between two samples should be calculated. The cluster distance metric specifies how you want the distance between two clusters, each consisting of a number of samples, to be calculated.
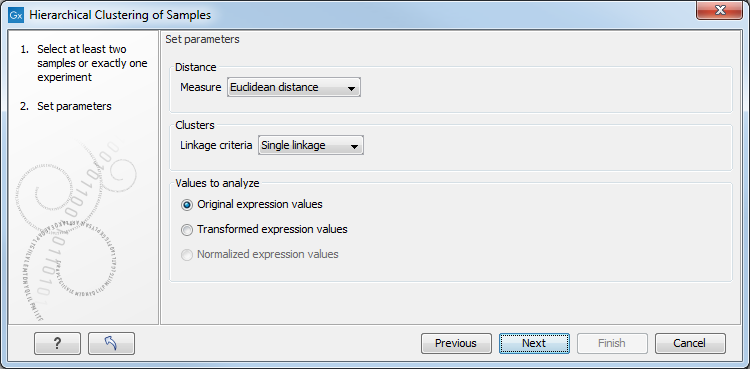
Figure 31.32: Parameters for hierarchical clustering of samples.
There are three kinds of Distance measures:
- Euclidean distance. The ordinary distance between two points - the length of the segment connecting them. If
 and
and
 ,
then the Euclidean distance between
,
then the Euclidean distance between  and
and  is
is
- 1 - Pearson correlation. The Pearson correlation coefficient between two elements
 and
and
 is defined as
where
is defined as
where
 is the average of values in
  and
and  is the sample standard deviation of these values.
It takes a value
is the sample standard deviation of these values.
It takes a value
![$ \in [-1,1]$](img294.gif) . Highly correlated elements have a high absolute value of the Pearson correlation, and elements whose values are un-informative about each other have Pearson correlation 0. Using
. Highly correlated elements have a high absolute value of the Pearson correlation, and elements whose values are un-informative about each other have Pearson correlation 0. Using
 as distance measure means that elements that are highly correlated will have a short distance between them, and elements that have low correlation will be more distant from each other.
- Manhattan distance. The Manhattan distance between two points is the distance measured along axes at right angles. If
and
,
then the Manhattan distance between and is
The possible cluster linkages are:
- Single linkage. The distance between two clusters is computed as the distance between the two closest elements in the two clusters.
- Average linkage. The distance between two clusters is computed as the average distance between objects from the first cluster and
objects from the second cluster. The averaging is performed over all pairs
 , where
  is an object from the first cluster and
  is an object
from the second cluster.
is an object
from the second cluster.
- Complete linkage. The distance between two clusters is computed as the maximal object-to-object distance
 , where
  comes from the first cluster,
and
comes from the first cluster,
and  comes from the second cluster. In other words, the distance between two clusters is computed as the distance between the two farthest objects in the two clusters.
At the bottom, you can select which values to cluster (see Selecting transformed and normalized values for analysis).
Click Finish to start the tool.
Note: To be run on a server, the tool has to be included in a workflow, and the results will be displayed in a a stand-alone new heat map rather than added into the input experiment table.
Subsections