Bioinformatics explained: Protein hydrophobicity
Calculation of hydrophobicity is important to the identification of various protein features. This can be membrane spanning regions, antigenic sites, exposed loops or buried residues. Usually, these calculations are shown as a plot along the protein sequence, making it easy to identify the location of potential protein features.
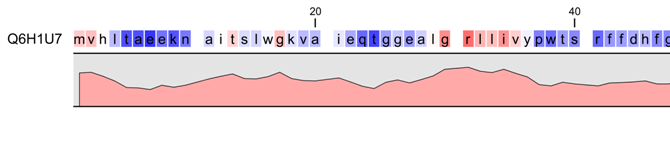
Figure 17.9: Plot of hydrophobicity along the amino acid sequence.
Hydrophobic regions on the sequence have higher numbers according to the
graph below the sequence, furthermore hydrophobic regions are colored on the sequence.
Red indicates regions with high hydrophobicity and blue indicates
regions with low hydrophobicity.
The hydrophobicity is calculated by sliding a fixed size window (of an odd number) over the protein sequence. At the central position of the window, the average hydrophobicity of the entire window is plotted (see figure 17.9).
Hydrophobicity scales
Several hydrophobicity scales have been published for various uses. Many of the commonly used hydrophobicity scales are described below.
- Kyte-Doolittle scale.
The Kyte-Doolittle scale is widely used for detecting hydrophobic
regions in proteins. Regions with a positive value are hydrophobic.
This scale can be used for identifying both surface-exposed regions
as well as transmembrane regions, depending on the window size used.
Short window sizes of 5-7 generally work well for predicting
putative surface-exposed regions. Large window sizes of 19-21 are
well suited for finding transmembrane domains if the values
calculated are above 1.6 [Kyte and Doolittle, 1982]. These values should be
used as a rule of thumb and deviations from the rule may occur.
- Engelman scale. The
Engelman hydrophobicity scale, also known as the GES-scale, is
another scale which can be used for prediction of protein
hydrophobicity [Engelman et al., 1986]. As the Kyte-Doolittle scale,
this scale is useful for predicting transmembrane regions in
proteins.
- Eisenberg scale. The
Eisenberg scale is a normalized consensus hydrophobicity scale
which shares many features with the other hydrophobicity scales
[Eisenberg et al., 1984].
- Hopp-Woods scale. Hopp and
Woods developed their hydrophobicity scale for identification of
potentially antigenic sites in proteins. This scale is basically a
hydrophilic index where apolar residues have been assigned negative
values. Antigenic sites are likely to be predicted when using a
window size of 7 [Hopp and Woods, 1983].
- Cornette scale. Cornette
et al. computed an optimal hydrophobicity scale based on 28
published scales [Cornette et al., 1987]. This optimized scale is also
suitable for prediction of alpha-helices in proteins.
- Rose scale. The hydrophobicity
scale by Rose et al. is correlated to the average area of
buried amino acids in globular proteins [Rose et al., 1985]. This
results in a scale which is not showing the helices of a protein,
but rather the surface accessibility.
- Janin scale. This scale also
provides information about the accessible and buried amino acid residues of globular proteins [Janin, 1979].
- Welling scale.
Welling et al. used information on the relative occurrence of amino acids in antigenic regions to make a scale which is useful for prediction of antigenic regions. This method is better than the Hopp-Woods scale of hydrophobicity which is also used to identify antigenic regions.
- Kolaskar-Tongaonkar.
A semi-empirical method for prediction of antigenic regions has been developed [Kolaskar and Tongaonkar, 1990]. This method also includes information of surface accessibility and flexibility and at the time of publication the method was able to predict antigenic determinants with an accuracy of 75%.
- Surface
Probability. Display of surface probability based on the algorithm
by [Emini et al., 1985]. This algorithm has been used to identify
antigenic determinants on the surface of proteins.
- Chain Flexibility. Display of backbone chain flexibility based on the algorithm by [Karplus and Schulz, 1985]. It is known that chain flexibility is an indication of a putative antigenic determinant.
Many more scales have been published throughout the last three decades. Even though more advanced methods have been developed for prediction of membrane spanning regions, the simple and very fast calculations are still highly used.
| aa | aa | Kyte-Doolittle | Hopp-Woods | Cornette | Eisenberg | Rose | Janin | Engelman GES |
| A | Alanine | 1.80 | -0.50 | 0.20 | 0.62 | 0.74 | 0.30 | 1.60 |
| C | Cysteine | 2.50 | -1.00 | 4.10 | 0.29 | 0.91 | 0.90 | 2.00 |
| D | Aspartic acid | -3.50 | 3.00 | -3.10 | -0.90 | 0.62 | -0.60 | -9.20 |
| E | Glutamic acid | -3.50 | 3.00 | -1.80 | -0.74 | 0.62 | -0.70 | -8.20 |
| F | Phenylalanine | 2.80 | -2.50 | 4.40 | 1.19 | 0.88 | 0.50 | 3.70 |
| G | Glycine | -0.40 | 0.00 | 0.00 | 0.48 | 0.72 | 0.30 | 1.00 |
| H | Histidine | -3.20 | -0.50 | 0.50 | -0.40 | 0.78 | -0.10 | -3.00 |
| I | Isoleucine | 4.50 | -1.80 | 4.80 | 1.38 | 0.88 | 0.70 | 3.10 |
| K | Lysine | -3.90 | 3.00 | -3.10 | -1.50 | 0.52 | -1.80 | -8.80 |
| L | Leucine | 3.80 | -1.80 | 5.70 | 1.06 | 0.85 | 0.50 | 2.80 |
| M | Methionine | 1.90 | -1.30 | 4.20 | 0.64 | 0.85 | 0.40 | 3.40 |
| N | Asparagine | -3.50 | 0.20 | -0.50 | -0.78 | 0.63 | -0.50 | -4.80 |
| P | Proline | -1.60 | 0.00 | -2.20 | 0.12 | 0.64 | -0.30 | -0.20 |
| Q | Glutamine | -3.50 | 0.20 | -2.80 | -0.85 | 0.62 | -0.70 | -4.10 |
| R | Arginine | -4.50 | 3.00 | 1.40 | -2.53 | 0.64 | -1.40 | -12.3 |
| S | Serine | -0.80 | 0.30 | -0.50 | -0.18 | 0.66 | -0.10 | 0.60 |
| T | Threonine | -0.70 | -0.40 | -1.90 | -0.05 | 0.70 | -0.20 | 1.20 |
| V | Valine | 4.20 | -1.50 | 4.70 | 1.08 | 0.86 | 0.60 | 2.60 |
| W | Tryptophan | -0.90 | -3.40 | 1.00 | 0.81 | 0.85 | 0.30 | 1.90 |
| Y | Tyrosine | -1.30 | -2.30 | 3.20 | 0.26 | 0.76 | -0.40 | -0.70 |
Other useful resources
AAindex: Amino acid index database
http://www.genome.ad.jp/dbget/aaindex.html