GO Enrichment Analysis
This tool can be used to investigate candidate variants, or better their corresponding altered genes for a common functional role. For example if you would like to know what is interesting in the zebu cattle in comparison to bison and taurine cattle, you can use this tool. For that approach, first filter all found variants in zebu for zebu-specific variants and afterwards run the GO enrichment test for biological process to see that more variants than expected are in immune response genes. These can then be further investigated.
You will need a GO association file to run this tool. Such a file includes gene names and associated Gene Ontology terms and can be downloaded that from the Gene Ontology web site for various species (http://www.geneontology.org/GO.downloads.annotations.shtml). Download the GO Annotations of the relavant species by clicking on the *.gz link in the table (see figure 29.27). Import the downloaded annotations into the workbench using Import | Standard Import.
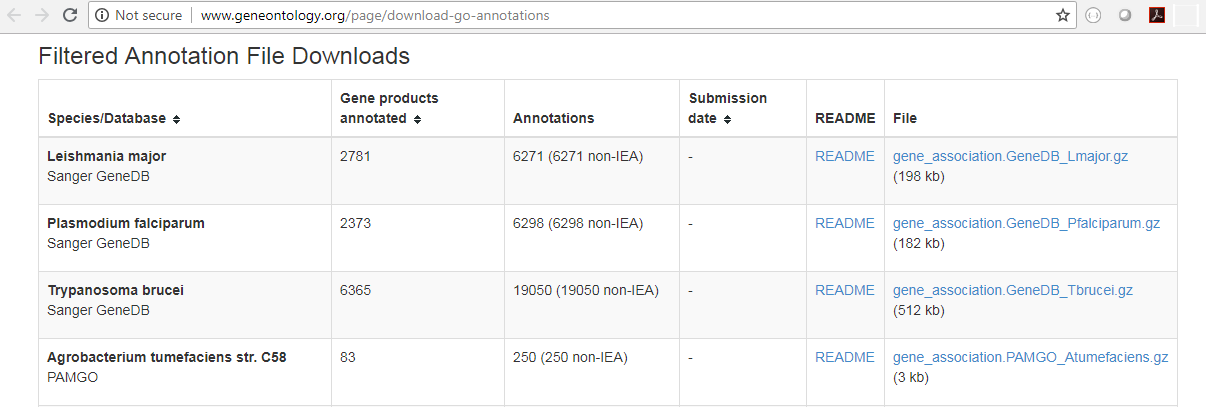
Figure 29.27: Download the GO Annotations by clicking on the *.gz link in the table.
You will also need a Gene track for the relevant species (learn more about gene tracks in the Track types section).
To run the GO Enrichment analysis, go to the toolbox:
Toolbox | Resequencing Analysis (![]() ) | Functional Consequences (
) | Functional Consequences (![]() ) | GO Enrichment Analysis (
) | GO Enrichment Analysis (![]() )
)
First, select the variant track containing the variants to analyse. You then have to specify both the annotation association file and the gene track. Finally, choose which ontology (cellular component, biological process or molecular function) you would like to test for (see figure 29.28).
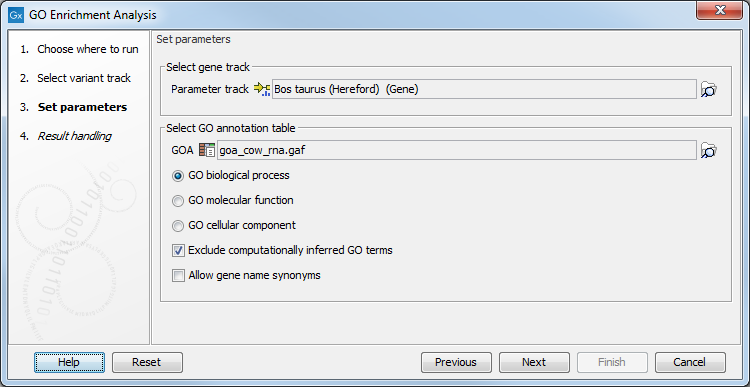
Figure 29.28: The GO enrichment settings.
The analysis starts by associating all of the variants from the input variant file with genes in the gene track, based on overlap with the gene annotations.
Next, the Workbench tries to match gene names from the gene (annotation) track with the gene names in the GO association file. Note that the same gene name definition should be used in both files.
Finally, an hypergeometric test is used to identify over-represented GO terms by testing whether some of the GO terms are over-represented in a given gene set, compared to a randomly selected set of genes.
The result is a table with GO terms and the calculated p-value for the candidate variants, as well as a new variant file with annotated GO terms and the corresponding p-value (see figure 29.29). The p-value is the probability of obtaining a test statistic at least as extreme as the one that was actually observed, or in other words how significant (trustworthy) a result is. In case of a small p-value the probability of achieving the same result by chance with the same test statistic is very small.
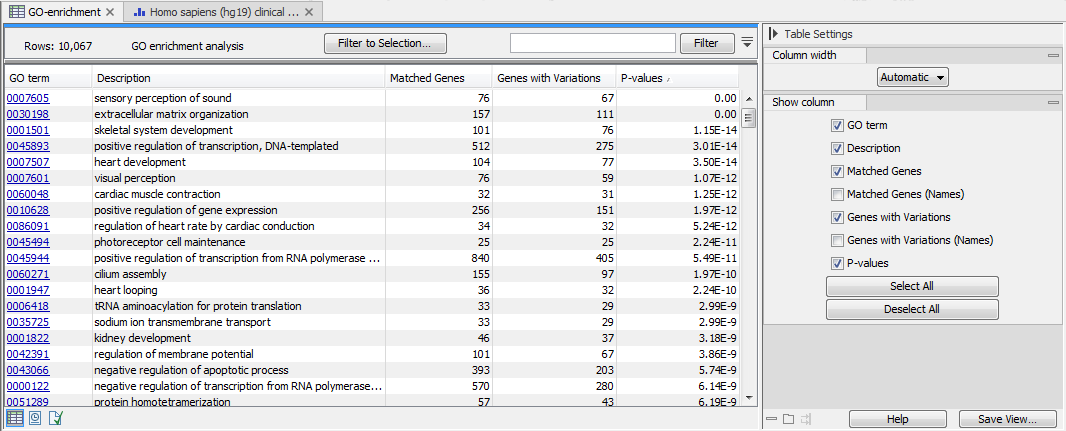
Figure 29.29: The results of the analysis.
In addition to the p-values, the table lists for each GO term the number and names of the genes that matched, and the number and names of the matched genes that contains at least one variant.