The algorithm
Consider an RNA molecule and one of its possible structures ![]() . In a stable solution there will be an equilibrium between unstructured RNA strands and RNA strands folded into
. In a stable solution there will be an equilibrium between unstructured RNA strands and RNA strands folded into ![]() . The propensity of a strand to leave a structure such as
. The propensity of a strand to leave a structure such as ![]() (the stability of
(the stability of ![]() ), is determined by the free energy change involved in its formation. The structure with the lowest free energy (
), is determined by the free energy change involved in its formation. The structure with the lowest free energy (![]() ) is the most stable and will also be the most represented structure at equilibrium.
The objective of minimum free energy (MFE) folding is therefore to identify
) is the most stable and will also be the most represented structure at equilibrium.
The objective of minimum free energy (MFE) folding is therefore to identify ![]() amongst all possible structures.
amongst all possible structures.
In the following, we only consider structures without pseudoknots, i.e. structures that do not contain any non-nested base pairs.
Under this assumption, a sequence can be folded into a single coherent structure or several sequential structures that are joined by unstructured regions. Each of these structures is a union of well described structure elements (see below for a description of these). The free energy for a given structure is calculated by an additive nearest neighbor model. Additive, means that the total free energy of a secondary structure is the sum of the free energies of its individual structural elements. Nearest neighbor, means that the free energy of each structure element depends only on the residues it contains and on the most adjacent Watson-Crick base pairs.
The simplest method to identify ![]() would be
to explicitly generate all possible structures, but it can be shown
that the number of possible structures for a sequence grows
exponentially with the sequence length [Zuker and Sankoff, 1984] leaving
this approach unfeasible. Fortunately, a two step algorithm can be constructed
which implicitly surveys all possible structures without
explicitly generating the structures [Zuker and Stiegler, 1981]:
The first step determines the free energy for each possible
sequence fragment starting with the shortest fragments. Here, the
lowest free energy for longer fragments can be expediently calculated from the free energies of the smaller sub-sequences they
contain. When this process reaches the longest fragment, i.e.,
the complete sequence, the MFE of the entire molecule is known. The second step is
called traceback, and uses all the free energies computed in the
first step to determine
would be
to explicitly generate all possible structures, but it can be shown
that the number of possible structures for a sequence grows
exponentially with the sequence length [Zuker and Sankoff, 1984] leaving
this approach unfeasible. Fortunately, a two step algorithm can be constructed
which implicitly surveys all possible structures without
explicitly generating the structures [Zuker and Stiegler, 1981]:
The first step determines the free energy for each possible
sequence fragment starting with the shortest fragments. Here, the
lowest free energy for longer fragments can be expediently calculated from the free energies of the smaller sub-sequences they
contain. When this process reaches the longest fragment, i.e.,
the complete sequence, the MFE of the entire molecule is known. The second step is
called traceback, and uses all the free energies computed in the
first step to determine ![]() - the exact structure associated with the MFE.
Acceptable calculation speed is achieved by using dynamic programming where
sub-sequence results are saved to avoid recalculation. However, this comes at the price of
a higher requirement for computer memory.
- the exact structure associated with the MFE.
Acceptable calculation speed is achieved by using dynamic programming where
sub-sequence results are saved to avoid recalculation. However, this comes at the price of
a higher requirement for computer memory.
The structure element energies that are used in the recursions of these two steps, are derived from empirical calorimetric experiments performed on small molecules see e.g. [Mathews et al., 1999].
Suboptimal structures determination
A number of known factors violate the assumptions that are implicit in MFE structure prediction. [Schroeder et al., 1999] and [Chen et al., 2004] have shown experimental indications that the thermodynamic parameters are sequence dependent. Moreover, [Longfellow et al., 1990] and [Kierzek et al., 1999], have demonstrated that some structural elements show non-nearest neighbor effects. Finally, single stranded nucleotides in multi loops are known to influence stability [Mathews and Turner, 2002].
These phenomena can be expected to limit the accuracy of RNA secondary structure prediction by free energy minimization and it should be clear that the predicted MFE structure may deviate somewhat from the actual preferred structure of the molecule. This means that it may be informative to inspect the landscape of suboptimal structures which surround the MFE structure to look for general structural properties which seem to be robust to minor variations in the total free energy of the structure.
An effective procedure for generating a sample of suboptimal structures is given in [Zuker, 1989a]. This algorithm works by going through all possible Watson-Crick base pair in the molecule. For each of these base pairs, the algorithm computes the most optimal structure among all the structures that contain this pair, see figure 23.28.
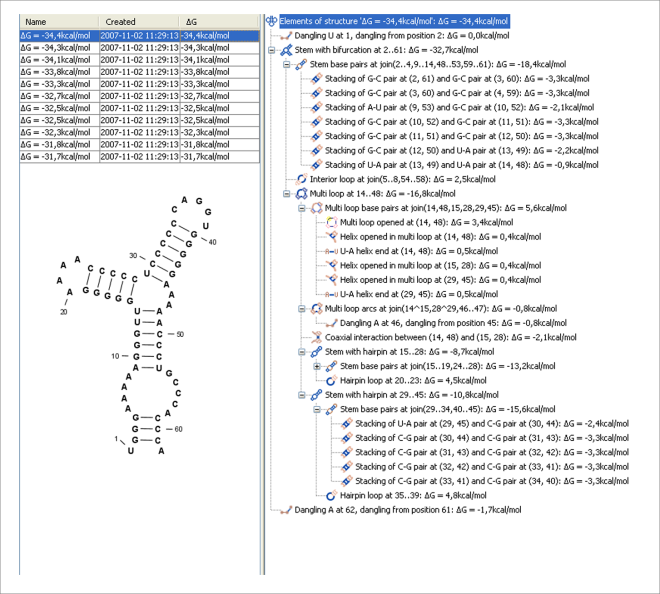
Figure 23.28: A number of suboptimal structures have been predicted using CLC Genomics Workbench and are listed at the top left. At the right hand side, the structural components of the selected structure are listed in a hierarchical structure and on the left hand side the structure is displayed.