QC for Sequencing Reads
Quality assurance as well as concern regarding sample authenticity in biotechnology and bioengineering have always been serious topics in both production and research. While next generation sequencing techniques greatly enhance in-depth analyses of DNA-samples, they, however, introduce additional error-sources. Resulting error-signatures can neither be easily removed from resulting sequencing data nor even recognized, which is mainly due to the massive amount of data. Altogether biologists and sequencing facility technicians face not only issues of minor relevance, e.g. suboptimal library preparation, but also serious incidents, including sample-contamination or even mix-up, ultimately threatening the accuracy of biological conclusions.
Unfortunately, most of the problems and evolving questions raised above can't be solved and answered entirely. However, the sequencing data quality control tool of the CLC Genomics Workbench provides various generic tools to assist in the quality control process of the samples by assessing and visualizing statistics on:
- Sequence-read lengths and base-coverages
- Nucleotide-contributions and base-ambiguities
- Quality scores as emitted by the variation detection tool
- Over-represented sequences and hints suggesting contamination events
This tool aims at assessing above quality-indicators and investigates proper and improper result presentation. The inspiration comes from the FastQC-project (http://www.bioinformatics.babraham.ac.uk/projects/fastqc/).
Note that currently, adapter contamination, i.e., adapter sequences in the reads, cannot be detected in a reliable way with this tool. In some cases, adapter contamination will show up as enriched 5-mers near the end of sequences but only if the contamination is severe.
The tool is found in the Toolbox:
Toolbox | Prepare Sequencing Data (![]() ) | QC for Sequencing Reads (
) | QC for Sequencing Reads (![]() )
)
Select one or more sequence lists with sequencing reads as input. If sequence lists in the Navigation Area were already selected, these will be shown in the Selected Elements window. When multiple lists are selected as an input, they are all analyzed in one pool. If you need separate reports for each data set, you can run it in a batch. Click Next to adjust output options which allow you to select the graphical and supplementary report.
The report comes in two different flavors: a supplementary report consisting of tables representing all the values that are calculated, and a main summary graphical report where the tables are visualized in plots (see an example in figure 25.1). Both reports can be exported as pdf files or Excel spread sheets.
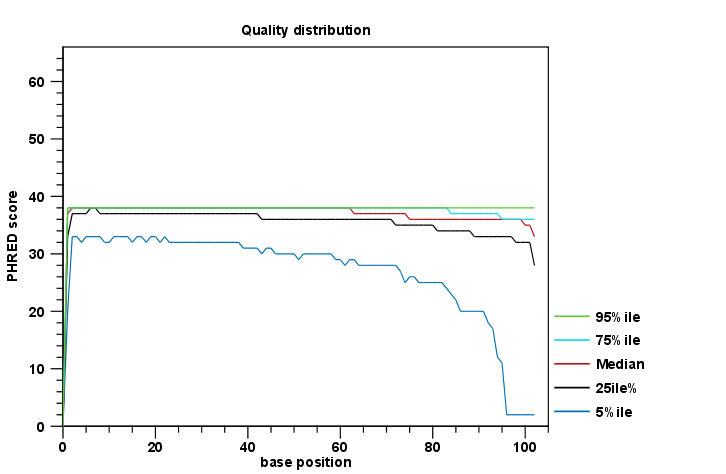
Figure 25.1: An example of a plot from the graphical report, showing the quality values per base position.
The Summary table provides information regarding the creation date, the author, the software used, the number of data sets the report is based upon, as well as data name and content in terms of read number and total number of nucleotides. The report is then divided in per-sequence and per-base analyses. In the per-sequence analyses, some characteristic (a single value) is assessed for each sequence and then contributes to the overall assessment. In per-base assessments each base position is examined and counted independently. In both sections, the first items assess the most simple characteristics that are supported by all sequencing technologies while the quality analyses examine quality scores reported from technology-dependent base callers. Please note that the NGS import tools of the CLC Genomics Workbench and CLC Genomics Server convert quality scores to PHRED-scale, regardless of the data source.
Subsections