De novo assembly report
A denovo assembly reports looks like the one shown in figure 32.21.
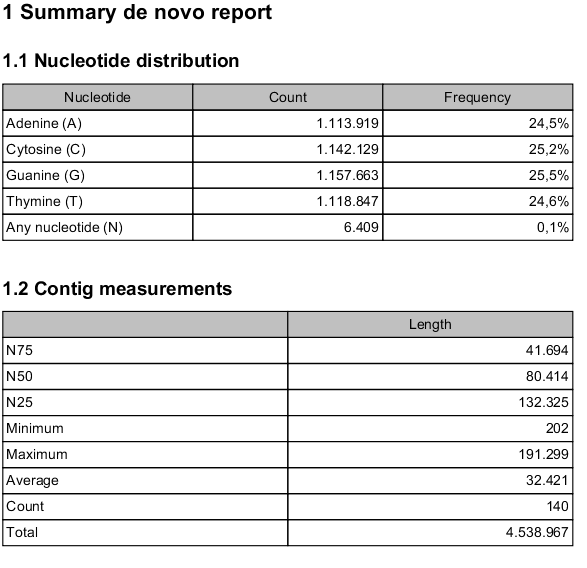
Figure 32.21: Creating a de novo assembly report.
The report contains the following information when both scaffolding and read mapping is performed:
- Nucleotide distribution
- This includes Ns when scaffolding has been performed.
- Contig measurements
- This section includes statistics about the number and lengths of contigs. When scaffolding is performed and the update contigs option is not selected, there will be two separate sections with these numbers: one including the scaffold regions with Ns and one without these regions.
- N25, N50 and N75 The N25 contig set is calculated by summarizing the lengths of the biggest contigs until you reach 25 % of the total contig length. The minimum contig length in this set is the number that is usually used to report the N25 value of a de novo assembly. The same goes with N50 and N75 which are the 50 % and 75 % of the total contig length, respectively.
- Minimum, maximum and average This refers to the contig lengths.
- Count The total number of contigs.
- Total The number of bases in the result. This can be used for comparison with the estimated genome size to evaluate how much of the genome sequence is included in the assembly.
- Accumulated contig lengths
- This shows the summarized contig length on the y axis and the number of contigs on the x axis, with the biggest contigs ranked first. This answers the question: how many contigs are needed to cover e.g. half of the genome.
- Summary statistics
- Gives the count, average length and total bases amount for all reads, matched and non-matched reads, contigs, reads in pairs, and broken paired reads.
- Distribution of read length
- For each sequence length, you can see the number of reads and the distribution in percent. This is mainly useful if you don't have too much variance in the lengths as in Sanger sequencing data for example.
- Distribution of matched read length
- Equivalent to the above, except that this includes only the reads that have been matched to a contig.
- Distribution of non-matched read length
- Shows the distribution of lengths of the unmapped sequences.
- Paired reads distance distribution
- Shows the distribution of paired reads distances.
For a more detailed report, use the QC for Read Mapping tool, and see the description of the report in see Detailed mapping report.