Gene Set Test
The Gene Set Test tool tests whether GO terms are over-represented in a set of differentially expressed genes (input as a statistical comparison track) using a hypergeometric test. The tool will require a GO annotation file that must be previously saved in the Navigation Area of the workbench.
GO annotation files are available from several sources (Blast2Go, GO ontology database). Before import, check that the table does have a GO column, and if not, edit the table to change the relevant column header to GO before import in the workbench using the Standard Import function. For GO annotation files in GAF format, use the option "Force import as type: Gene Ontology Annotation file" from the drop down menu at the bottom of the Standard Import dialog.
RefSeq files are available via the Reference Data Manager, and are saved in the "CLC_Reference" folder in the Navigation Area if you have already downloaded a Reference Data Set.
It is also possible to format a text file of custom annotations into a format the Gene Set Test tool can use (see Generic annotation file for expression data format and Generic ontology annotation files).
- The file type should be *.csv.
- The values should be comma-separated and in quotation marks.
- The first column should be "Probe Set ID" or one of the other recognized values mentioned in the manual, and the values in the first column must match the feature names in the data exactly.
- The actual annotations should be found in one of the "Gene Ontology"-type columns: Gene Ontology Biological Process, Gene Ontology Cellular Component, Gene Ontology Molecular Function.
- The separator // is used to separate the name of an annotation from its description, and the separator /// is used to separate different annotations from each other. Each annotation should then look like: "AnnotationA_name // AnnotationA description /// AnnotationB_name // AnnotationB description".
This custom annotation file can be imported using the Standard Import functionality.
To start the tool:
Toolbox | RNA-Seq and Small RNA Analysis (![]() )| Gene Set Test (
)| Gene Set Test (![]() )
)
Select a statistical comparison track (![]() ) and click Next (see figure 30.40). To run several statistical comparisons at once, use the batch function.
) and click Next (see figure 30.40). To run several statistical comparisons at once, use the batch function.
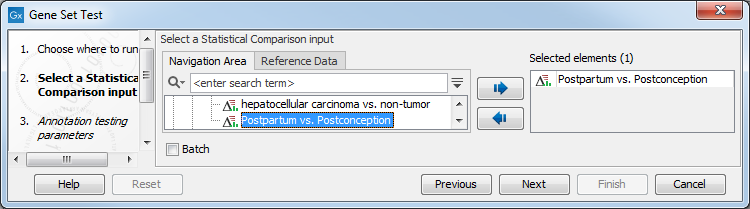
Figure 30.40: Select one statistical comparison.
In the "Annotation testing parameters" dialog, you need to specify a GO annotation file and have several annotation testing options(see figure 30.41).
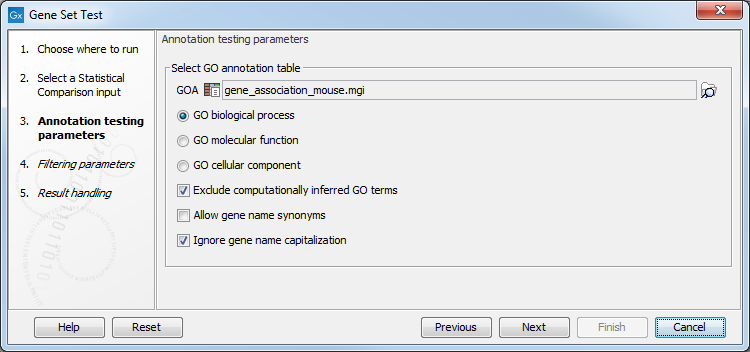
Figure 30.41: Select annotation tetsing parameters.
- GOA: Specify a GO annotation file (such as described in the introduction of this section) using the Browse button to the right of the field.
- GO biological process Tests for enriched GO biological processes, i.e., a series of events or molecular functions such as "lipid storage" or "chemical homeostasis".
- GO molecular function Tests for enriched GO molecular functions. The GO molecular functions of a gene can be such as "retinoic acid receptor activity" or "transcription regulator activity".
- GO cellular component Tests for enriched GO cellular component. A GO cellular component ontology describes locations, such as "nuclear inner membrane" or "ubiquitine ligase complex".
- Exclude computationally inferred GO terms excludes uncurated GO terms with evidence code IEA, i.e., terms that were automatically curated but not reviewed by a curator.
- Allow gene name synonyms allows matching of the gene name with database identifiers and synonyms.
- Ignore gene name capitalization ignores capitalization in feature names: a gene called "Dat" in the statistical comparison track will be matched with the one called "dat" in the annotation file when this option is checked. If "Dat" and "dat" are believe to be different genes, the option should be unchecked.
Click Next to access the "Filtering parameters" dialog (see figure 30.42).
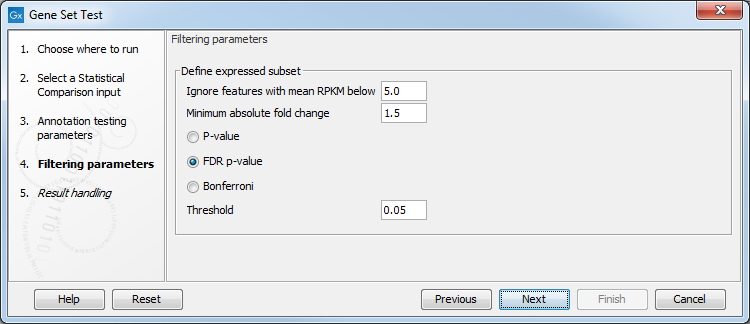
Figure 30.42: Specify filtering parameters.
Instead of annotating all genes present in the statistical comparison track, it is possible to focus on the subset of genes that are differentially expressed. The filtering parameters allow you to define this subset:
- Ignore features with mean RPKM below. Only features where the highest group mean RPKM exceeds this limit will be included in the analysis.
- Minimum absolute fold change. Define the minimum absolute fold change value for a feature, and specify whether this fold change should calculated as p-value, FDR p-value or Bonferroni (for a detailed definition of these, see Corrected p-values).
- Threshold. Maximum p-value for a feature.
Click Finish to open or save the file in a specified location of the Navigation Area.
During analysis, a black banner in the left hand side of the workbench warns if duplicate features were found while processing the file. If you get this warning message, consider unchecking the "Ignore gene name capitalization" option.
The output is a table called "GO enrichment analysis" (see figure 30.43). The table is sorted in order of ascending p-values but it can easily be sorted differently, as well as filtered to highlight only the GO terms that are over-represented.
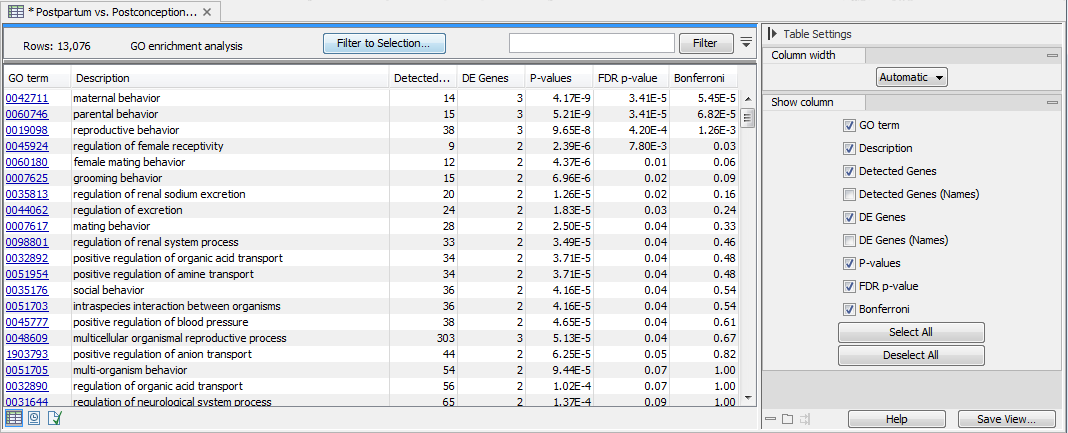
Figure 30.43: The GO enrichment analysis table generated by the Gene Set Test tool.
The table lists for each GO term the number and names of Detected Genes, i.e., the total number of genes in the annotation for a given GO term which is being considered for the analysis, and of DE (Differentially Expressed) Genes. Genes that are not detected (i.e., genes that have Max group mean = 0, meaning they are not expressed in any sample) are not included in the analysis. By excluding undetected genes, we make the background of the test specific to the experiment (for example, if someone is comparing liver cells under two conditions, then the most appropriate background is the set of genes expressed in the liver).
The table also provides FDR and Bonferroni-corrected p-values. When testing for the significance of a particular GO term, we take into account that GO has a hierarchical structure. For example, when testing for the term "GO:0006259 DNA metabolic process", we include all genes that are annotated with more specific GO terms that are types of DNA metabolic process such as "GO:0016444 somatic cell DNA recombination". Also note that the p-values provided in the table are meant as a guide, as GO annotations are not strictly independent of each other (for example, "reproduction" is a broad category that encompass a nested set of terms from other categories such as "pheromone biosynthetic process").
Subsections