The grouped sample
An example of a grouped annotated sample is shown in figure 28.31.
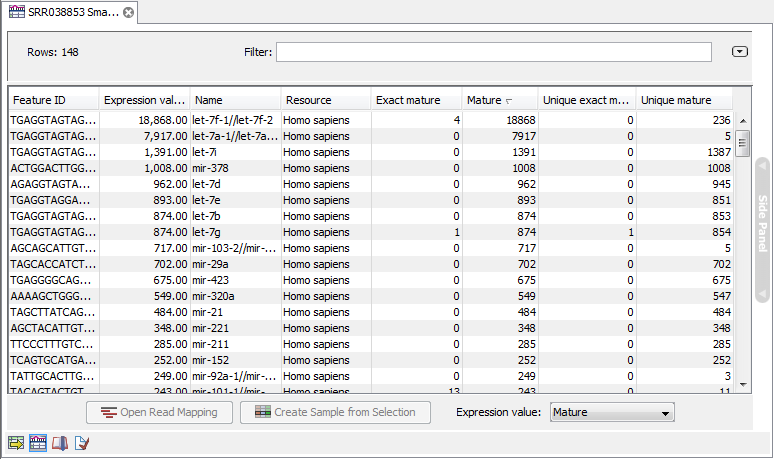
Figure 28.31: A sample grouped on mature 5' miRNAs.
The contents of the table are explained in Annotating and merging small RNA samples. In this section, we focus on the tools available for working with the sample.
By selecting one or more rows in the table, the buttons at the bottom of the view become active:
- Open Read Mapping (
 )
) - This will open a view showing the annotation reference sequence at the top and the tags aligned to it as shown in figure 28.32. The names of the tags indicate their status compared with the reference (e.g. Mature 5', Mature super 5', Precursor). This categorization is based on the choices you make when annotating. You can also see the annotations when using miRBase as the annotation source. In this example both the mature 5' and the mature 3' are annotated, and you can see that both are found in the sample. In the Side Panel to the right you can see the Match weight group under Residue coloring which is used to color the tags according to their relative abundance. The weight is also shown next to the name of the tag. The left side color is used for tags with low counts and the right side color is used for tags with high counts, relative to the total counts of this annotation reference. The sliders just above the gradient color box can be dragged to highlight relevant levels of abundance. The colors can be changed by clicking the box. This will show a list of gradients to choose from.
- Create Sample from Selection (
 )
) - This is used to create a new sample based on the tags that are selected. This can be useful in combination with filtering and sorting.
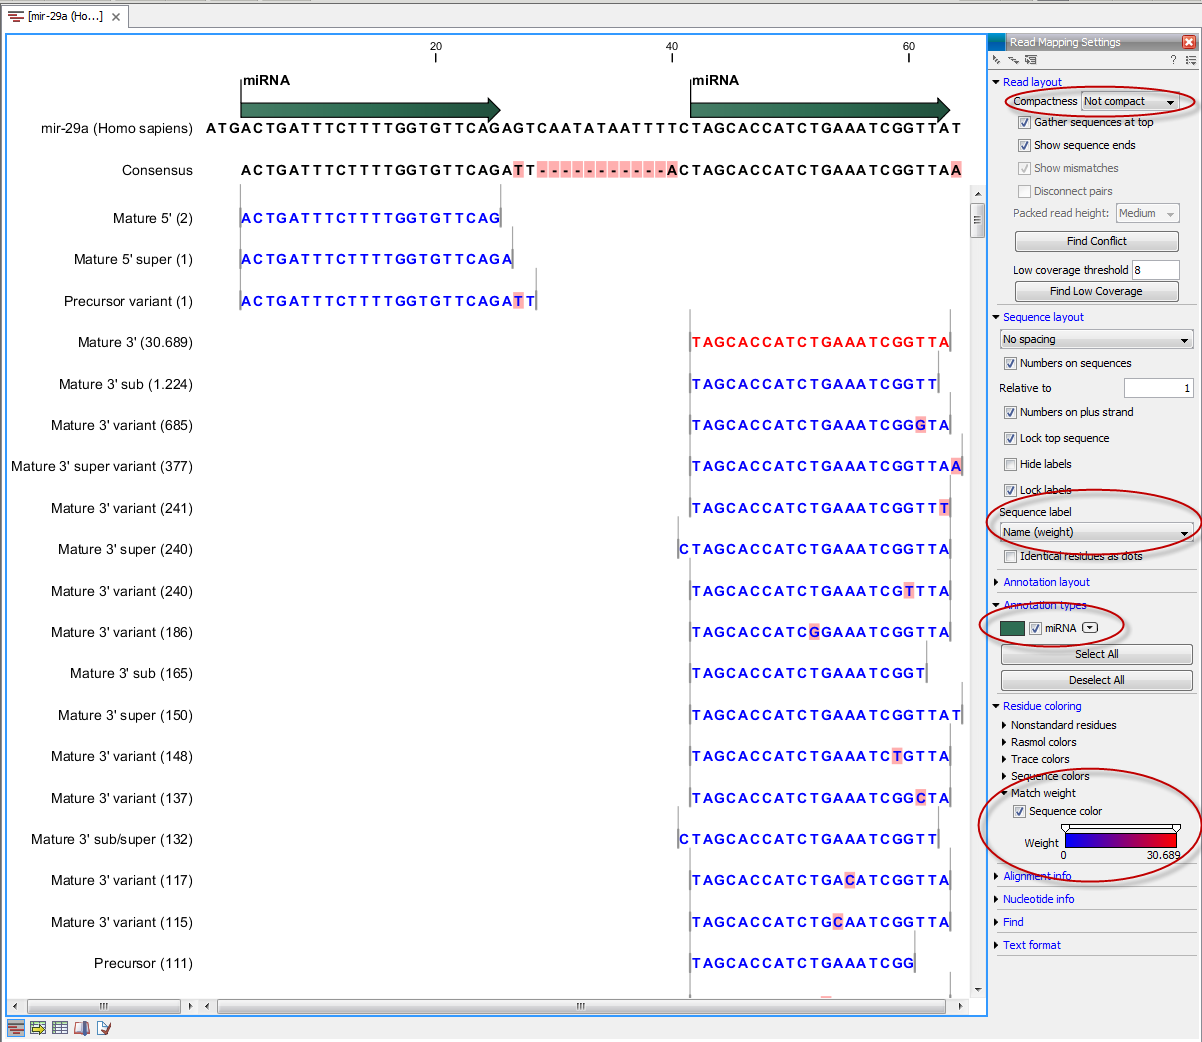
Figure 28.32: Aligning all the variants of this miRNA from miRBase, providing a visual overview of the distribution of tags along the precursor sequence.