Peak table and annotations
The main result is the table showing the peaks and the annotations added to the reference sequence.An example of a peak table is shown in figure 31.19.
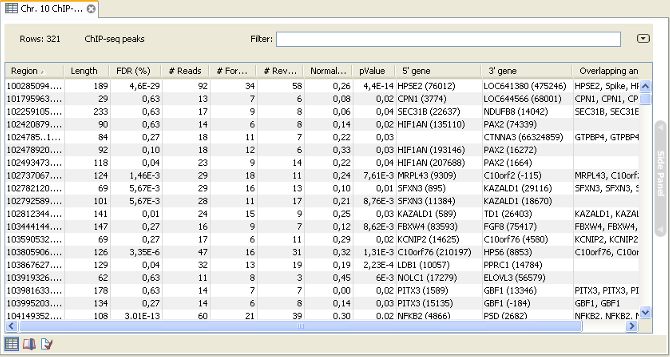
Figure 31.19: ChIP sequencing peak table.
The table includes information about each peak that has been found:
- Name. If the mapping was based on more than one reference sequence, the name of the reference sequence in question will be shown here.
- Region. The position of the peak. To find that position in the ChIP-sample mapping, you can make a split view of the table and the mapping of the table and the mapping (see http://www.clcsupport.com/clcgenomicsworkbench/current/index.php?manual=Arrange_views_in_View_Area.html). You will then be able to browse through the peaks by clicking in the table. This will cause the view to jump to the position of the peak region.
- Length. The length of the peak.
- FDR (%). The false discovery rate for the peak (learn more in Peak finding and false discovery rates).
- # Reads. The total number of reads covering the peak region. Note that the reported number of reads for a peak-region will be a higher than in the original read mapping. This is a result of shifting forward reads towards the 3' end and reverse reads towards the 5' by the expected length of the sequencing input fragments. See above .
- # Forward reads. The number of forward reads covering the peak region.
- # Reverse reads. The number of reverse reads covering the peak region. The normalized difference in the count of forward-reverse reads is calculated based on these numbers (see figure 31.15).
- Normalized difference. See Peak refinement.
- P-value. The p-value is for the Wilcoxon rank sum test for the equality of location of forward and reverse reads in a peak. See Peak refinement.
- Max forward coverage. The refined region described in Peak refinement is calculated based on the maximum coverage of forward and reverse reads.
- Max reverse coverage. See previous.
- Refined region. The refined region.
- Refined region length. The length of the refined region.
- 5' gene. The nearest gene upstream, based on the start position of the gene. The number in brackets is the distance from the peak to the gene start position.
- 3' gene. The nearest gene downstream, based on the start position of the gene. The number in brackets is the distance from the peak to the gene start position.
- Overlapping annotations. Displays any annotations present on the reference sequence that overlap the peak.
An example of a peak is shown in figure 31.20.
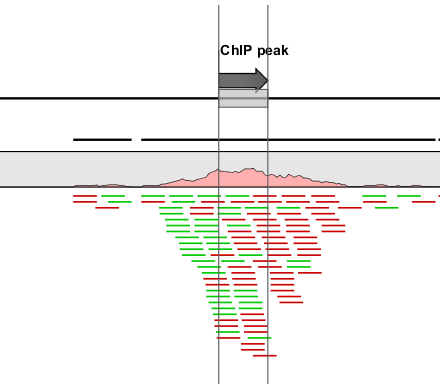
Figure 31.20: Inspecting an annotated peak. The green lines represent forward reads and the red lines represent reverse reads.
If you want to extract the sequence of all the peak regions to a list, you can use the Extract Annotations tool to extract all annotations of the type "Binding site".