Graph and table of background distribution and false discovery statistics
An example of a FDR graph based on a single ChIP-sample is shown in figure 31.17.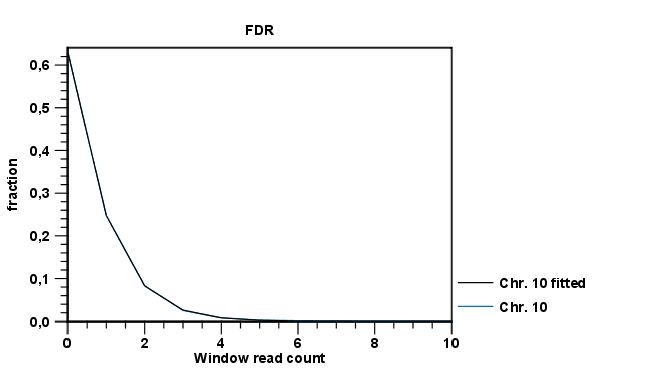
The graph shows the estimated background distribution of read counts in discrete windows and the observed counts and can thus be used to inspect how well the estimated distribution fits the observed pattern of coverage.
The FDR table displays the observed and expected fraction of windows with a given read count and also shows the rate of false discovery related to a given level of coverage within a window:
- # reads - the number of reads within a window.
- # windows - the number of windows with the given read count. A window of a fixed width is slid across the sequence. For every window position the number of reads in that window is recorded and stored as the read count. After this, the windows are counted based on their recorded read counts. # windows of read count x is thus the number of windows that were found to contain x reads during this process. This is done to establish the background distribution of coverage and to evaluate the fit of the estimated distribution.
- Observed - the observed faction of windows with the given read count.
- Expected under null - the expected fraction of windows with a given read count, under the null distribution.
- FDR % - the false discovery rate which is the fraction of the peaks with the given read count that can be expected to be false positives.
An example is shown in figure 31.18.
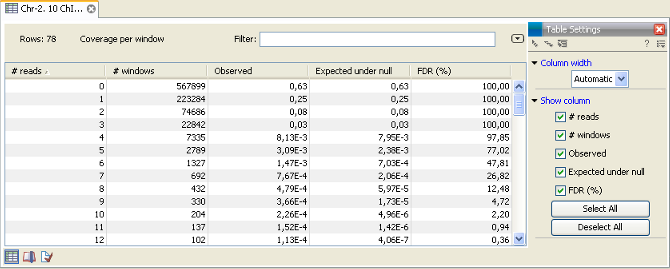
From this table you can see that less than 5% of the called peaks with 9 reads can be expected to be false discoveries and for peaks with 11 reads the FDR is less than 1%.