
Working with reports
Many tools output a report ( ) summarizing the performed analysis and the results. General features relevant to all reports are described in this chapter. For details on the content of a report produced by a particular tool, please refer to the manual section describing that tool. For details about export formats, see Export of reports.
The example report used throughout this chapter was produced using RNA-Seq Analysis in the CLC Genomics Workbench.
Report navigation
Reports can be navigated by scrolling or by using the section and subsection headings in the Table of Contents palette in the Side Panel (figure 10.1). Clicking a heading in the Table of Contents jumps to the corresponding location in the report. Sections that contain subsections can be expanded ( ) or collapsed (
 ) (figure 10.1). Clicking the arrow in front of the (sub)section's name switches between the expanded and collapsed states.
For reports with few sections and subsections, the Table of Contents is fully expanded by default. For reports with many sections, parts of the Table of Contents may be collapsed by default to provide an easily accessible overview of the whole report.
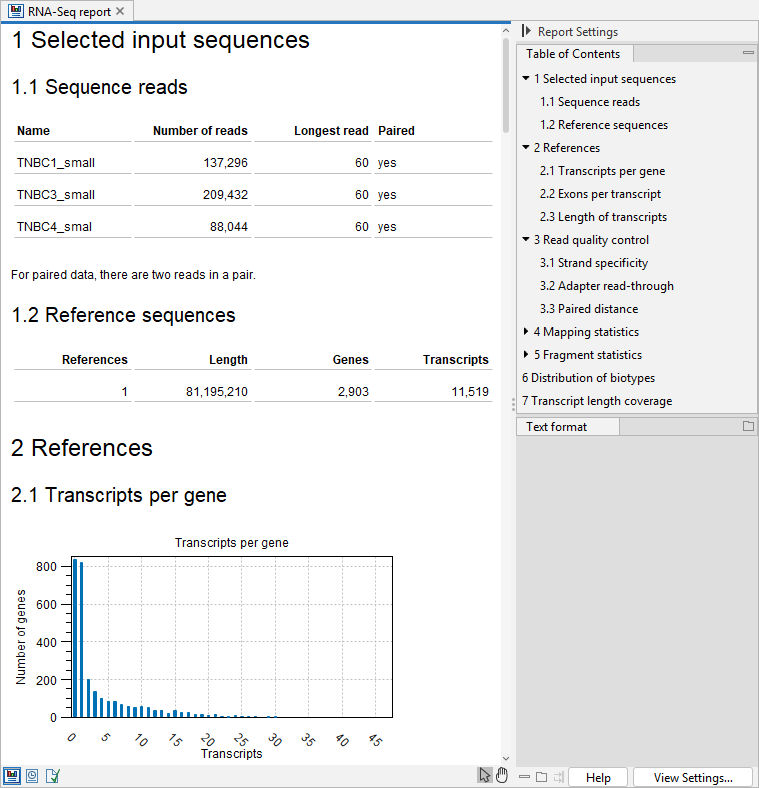
Figure 10.1: A report produced by RNA-Seq Analysis. Section 1 and part of section 2 are visible in the view. The Table of Contents palette in the Side Panel supports quick navigation to a particular section or subsection of the report.
Report plots
Plots embedded in reports can be opened in their own view, where they can be updated and saved back into the report:
- Double-click the plot to open it in the View Area.
- Edit the plot as relevant using the settings available in the Side Panel.
- Save the settings using the View Settings... button at the bottom right corner and choose Save for this element only.
- Save the plot view.
- Reopen the report to see the updated plot.
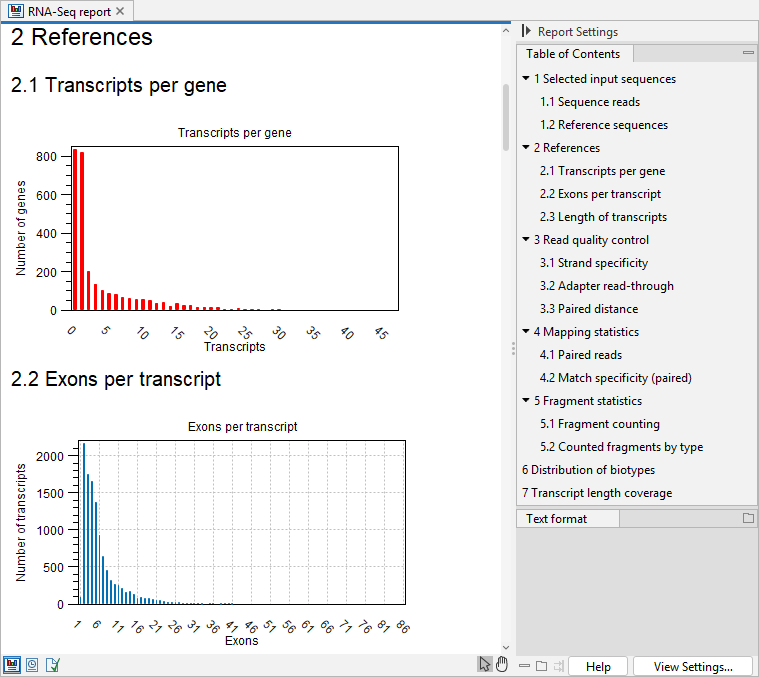
Figure 10.2: The plot in subsection 2.1 has been updated to use a different color. All sections in the Table of Contents palette are expanded.
Report tables
Tables embedded in reports can be opened in their own view where full table functionality is available. To open a report table, right-click it and choose Open Table (figure 10.3).
Selected cells, rows and/or columns can be copied to the clipboard as follows:
- Select the needed cells, rows or columns. For a contiguous range, hold Shift and click the first and last cell, or click and drag to select multiple cells.
- Copy the selected cells:
- Right-click the selected area, choose Edit and then Copy from the menu that appears (figure 10.3), or
- Use the keyboard shortcut Ctrl (
 on Mac) + C.
Copied cells are placed on the clipboard as plain, tab-separated text. Column headers are included only when they are part of the copied selection.
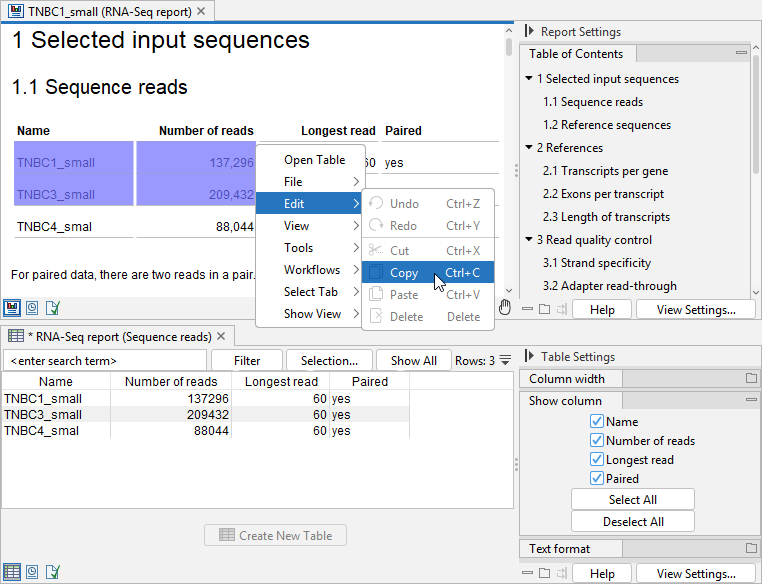
Figure 10.3: Top: a selected range of rows and columns ready to be copied. Bottom: the table from subsection 1.1 opened in a split view.
Only table content can be copied. Text outside tables cannot be copied.