Sequence view
In the Sequence view (![]() ) (
) (![]() ), you can see and edit a single sequence (DNA, RNA, or protein) at the residue level. Settings are available in the Side Panel at the right hand side of the view (figure 15.1). The view is instantly updated when these settings are changed. The options available for Sequence views are described in this section.
), you can see and edit a single sequence (DNA, RNA, or protein) at the residue level. Settings are available in the Side Panel at the right hand side of the view (figure 15.1). The view is instantly updated when these settings are changed. The options available for Sequence views are described in this section.
Note! Side Panel settings are not automatically saved when you save the sequence. See Side Panel view settings for information on saving and applying view settings.
For general information about Side Panels, see Side Panel.
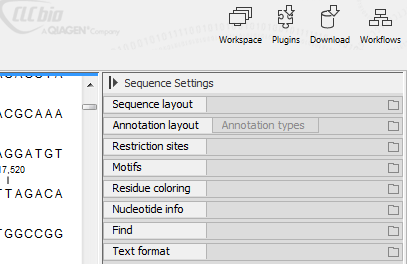
Figure 15.1: Overview of the Sequence view Side Panel. Each tab can be expanded to reveal settings that can be configured.
Sequence Layout
These preferences determine the overall layout of the sequence:
- Spacing. Inserts a space at a specified interval:
- No spacing. The sequence is shown with no spaces.
- Every 10 residues. There is a space every 10 residues, starting from the beginning of the sequence.
- Every 3 residues, frame 1. There is a space every 3 residues, corresponding to the reading frame starting at the first residue.
- Every 3 residues, frame 2. There is a space every 3 residues, corresponding to the reading frame starting at the second residue.
- Every 3 residues, frame 3. There is a space every 3 residues, corresponding to the reading frame starting at the third residue.
- Wrap sequences. Shows the sequence on more than one line.
- No wrap. The sequence is displayed on one line.
- Auto wrap. Wraps the sequence to fit the width of the view, no matter if it is zoomed in or out (displays minimum 10 nucleotides on each line).
- Fixed wrap. Makes it possible to specify when the sequence should be wrapped. In the text field below, you can choose the number of residues to display on each line.
- Double stranded. Shows both strands of a sequence (does not apply to protein sequences).
- Numbers on sequences. Shows residue positions along the sequence. The starting point can be changed by setting the number in the field below. If you set it to e.g. 101, the first residue will have the position of -100. This can also be done by right-clicking an annotation and choosing Set Numbers Relative to This Annotation.
- Numbers on plus strand. Whether to set the numbers relative to the positive or the negative strand in a nucleotide sequence (does not apply to protein sequences).
- Lock numbers. When you scroll vertically, the position numbers remain visible (only possible when the sequence is not wrapped).
- Hide labels. Do not show the sequence label to the left of the sequence.
- Lock labels. When you scroll horizontally, the sequence label remains visible.
- Sequence label. Defines the label to the left of the sequence.
- Name. This is the default information to be shown.
- Accession. Sequences downloaded from databases like GenBank have an accession number.
- Latin name.
- Latin name (accession).
- Common name.
- Common name (accession).
Annotation Layout and Annotation Types
See view annotations in sequence views.
Restriction sites
See dynamic restriction sites.
Motifs
Residue coloring
These preferences make it possible to color both the residue letter and set a background color for the residue. Colors can be used to show the following properties:
- Nonstandard residues. For nucleotide sequences, this will color the residues that are not C, G, A, T, or U. For amino acids only B, Z, and X are colored as nonstandard residues.
- Rasmol colors. Colors the residues according to the Rasmol color scheme.
- Trace colors (does not apply to protein sequences). Colors the residues according to the color conventions of chromatogram traces:
- Green. A
- Black. G
- Red. T
- Blue. C
- Polarity colors (only applies to protein sequences). Colors the residues according to the following categories:
- Green. Neutral, polar.
- Black. Neutral, nonpolar.
- Red. Acidic, polar.
- Blue. Basic, polar.
For each of these, the color can be selected as:
- Foreground color. Sets the color of the residue letter. Click the color box to change the color for Nonstandard residues and Rasmol colors.
- Background color. Sets the background color of the residues. Click the color box to change the color for Nonstandard residues and Rasmol colors.
Nucleotide info
The preferences described here do not apply to protein sequences.
Note that the data points for graph representations can be exported, see export graph data points to a file.
- Translation. Displays a translation into protein just below the nucleotide sequence. In cases where variants are present in the reads, synonymous variants are shown in orange in the translated sequence whereas non-synonymous are shown in red.
- Frame. Determines where to start the translation.
- +1, +2, +3, -1, -2, -3. Select one of the six reading frames.
- All forward/All reverse. Shows either all forward or all reverse reading frames.
- All. Select all reading frames at once. The translations will be displayed on top of each other.
- Selection. This option will only take effect when you make a selection on the sequence. The translation will start from the first nucleotide selected. Making a new selection will automatically display the corresponding translation.
- ORF/CDS. If the sequence is annotated, the translation will follow the CDS or ORF annotations. If annotations overlap, only one translation will be shown. If only one annotation is visible, the Workbench will attempt to use this annotation to mark the start and stop for the translation. In cases where this is not possible, the first annotation will be used (i.e. the one closest to the 5' end of the sequence).
- Table. The translation table to use in the translation.
- Only AUG start codons. For most genetic codes, a number of codons can be start codons (TTG, CTG, or ATG). These will be colored green, unless selecting the "Only AUG start codons" option, which will result in only the AUG codons colored in green.
- Single letter codes. Uncheck this option to represent the amino acids with three letters instead of a single letter. If you zoom out, the amino acids will still be displayed with one letter even though this option is unchecked.
- Frame. Determines where to start the translation.
- Quality scores. For sequencing data containing quality scores, the quality score information can be displayed along the sequence.
- Show as probabilities. Converts quality scores to error probabilities on a 0-1 scale, i.e. not log-transformed.
- Foreground color. Colors the residue letters using a gradient, where the left side color is used for low quality and the right side color is used for high quality. The sliders just above the gradient color box can be dragged to highlight relevant levels. The colors can be changed by clicking the box. This will show a list of gradients to choose from.
- Background color. Sets a background color of the residues using a gradient in the same way as described above for "Foreground color".
- Graph. The quality scores are displayed as a graph.
- Height. Specifies the height of the graph.
- Type. The graph can be displayed as a Line plot, Bar plot, or Color bar.
- Color box. For Line and Bar plots, the color of the plot can be set by clicking the color box. For Colors, the color box is replaced by a gradient color box as described above for "Foreground color".
- Trace data. See importing and viewing trace data.
- G/C content. Calculates the G/C content of a part of the sequence and shows it as a gradient of colors or as a graph below the sequence.
- Window length. Determines the length of the part of the sequence to calculate. A window length of 9 will calculate the G/C content for the nucleotide in question plus the 4 nucleotides to the left and the 4 nucleotides to the right. A narrow window will focus on small fluctuations in the G/C content level, whereas a wider window will show fluctuations between larger parts of the sequence.
- Foreground color. Colors the letter using a gradient, where the left side color is used for low levels of G/C content and the right side color is used for high levels of G/C content. The sliders just above the gradient color box can be dragged to highlight relevant levels of G/C content. The colors can be changed by clicking the box. This will show a list of gradients to choose from.
- Background color. Sets a background color of the residues using a gradient in the same way as described above for "Foreground color".
- Graph. The G/C content levels are displayed as a graph.
- Height. Specifies the height of the graph.
- Type. The graph can be displayed as a Line plot, Bar plot, or Color bar.
- Color box. For Line and Bar plots, the color of the plot can be set by clicking the color box. For Colors, the color box is replaced by a gradient color box as described above for "Foreground color".
- Secondary structure. Allows you to choose how to display a symbolic representation of the secondary structure along the sequence.
Protein info
The preferences described here apply only to protein sequences.
The first nine items are different hydrophobicity scales.
- Kyte-Doolittle. The Kyte-Doolittle scale is widely used for detecting hydrophobic regions in proteins. Regions with a positive value are hydrophobic. This scale can be used for identifying both surface-exposed regions as well as transmembrane regions, depending on the window size used. Short window sizes of 5-7 generally work well for predicting putative surface-exposed regions. Large window sizes of 19-21 are well suited for finding transmembrane domains if the values calculated are above 1.6 [Kyte and Doolittle, 1982]. These values should be used as a rule of thumb and deviations from the rule may occur.
- Cornette. Cornette et al. computed an optimal hydrophobicity scale based on 28 published scales [Cornette et al., 1987]. This optimized scale is also suitable for prediction of alpha-helices in proteins.
- Engelman. The Engelman hydrophobicity scale, also known as the GES-scale, is another scale which can be used for prediction of protein hydrophobicity [Engelman et al., 1986]. As the Kyte-Doolittle scale, this scale is useful for predicting transmembrane regions in proteins.
- Eisenberg. The Eisenberg scale is a normalized consensus hydrophobicity scale which shares many features with the other hydrophobicity scales [Eisenberg et al., 1984].
- Rose. The hydrophobicity scale by Rose et al. is correlated to the average area of buried amino acids in globular proteins [Rose et al., 1985]. This results in a scale which is not showing the helices of a protein, but rather the surface accessibility.
- Janin. This scale also provides information about the accessible and buried amino acid residues of globular proteins [Janin, 1979].
- Hopp-Woods. Hopp and Woods developed their hydrophobicity scale for identification of potentially antigenic sites in proteins. This scale is basically a hydrophilic index where apolar residues have been assigned negative values. Antigenic sites are likely to be predicted when using a window size of 7 [Hopp and Woods, 1983].
- Welling. Welling et al. used information on the relative occurrence of amino acids in antigenic regions to make a scale which is useful for prediction of antigenic regions [Welling et al., 1985]. This method is better than the Hopp-Woods scale of hydrophobicity which is also used to identify antigenic regions.
- Kolaskar-Tongaonkar. A semi-empirical method for prediction of antigenic regions has been developed [Kolaskar and Tongaonkar, 1990]. This method also includes information of surface accessibility and flexibility and at the time of publication the method was able to predict antigenic determinants with an accuracy of 75%.
- Surface Probability. Display of surface probability based on the algorithm by [Emini et al., 1985]. This algorithm has been used to identify antigenic determinants on the surface of proteins.
- Chain Flexibility. Display of backbone chain flexibility based on the algorithm by [Karplus and Schulz, 1985]. It is known that chain flexibility is an indication of a putative antigenic determinant.
Positional stats
The Side Panel palette Positional stats provides site-specific information about the sequence. Make a selection to populate the tab with information (figure 15.2).
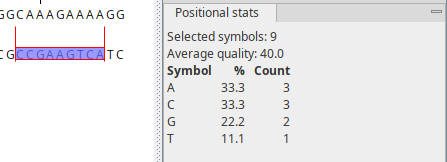
Figure 15.2: Contents of the "Positional stats" palette in the Side Panel.
The following information is provided:
- Selected symbols. The number of residues included across all selected positions.
- Residue symbol table. Statistics on residues in a tabular format.
- Symbol. List of the four nucleotide symbols or the 20 amino acid symbols.
- %. Percentage of the residue symbols at the selected position(s).
- Count. Number of the residue symbols at the selected position(s).
Find
The Find function can be used for searching the sequence and is invoked by pressing Ctrl + F (![]() + F on Mac). Initially, specify the 'search term' to be found, select the type of search (see the various options below), and finally click on the Find button. The first occurrence of the search term will then be highlighted. Clicking on the Find button again will find the next occurrence and so on. If the search string is found, the corresponding part of the sequence will be selected.
+ F on Mac). Initially, specify the 'search term' to be found, select the type of search (see the various options below), and finally click on the Find button. The first occurrence of the search term will then be highlighted. Clicking on the Find button again will find the next occurrence and so on. If the search string is found, the corresponding part of the sequence will be selected.
- Search term. Enter the text or number to search for. The search function does not discriminate between lower and upper case characters.
- Sequence. Search the nucleotides or amino acids. For amino acids, the single letter abbreviations should be used for searching. The sequence search also has a set of advanced search parameters:
- Include negative strand. This will search on the negative strand as well.
- Treat ambiguous residues as wildcards
- in search term. If you search for e.g. ATN, you will find both ATG and ATC. If you wish to find literally exact matches for ATN (i.e. only find ATN - not ATG), this option should not be selected.
- in sequence. Treat ambiguous characters as wildcards in sequence. If you search for e.g. ATG, you will find both ATG and ATN. If you have large regions of Ns, this option should not be selected.
- Annotation. Search the annotations on the sequence. The search is performed both on the labels of the annotations, but also on the text appearing in the tooltip that you see when you hover the mouse cursor over an annotation. If the search term is found, the part of the sequence corresponding to the matching annotation is selected. The option "Include translations" means that you can choose to search for translations which are part of an annotation (in some cases, CDS annotations contain the amino acid sequence in a "/translation" field). But it will not dynamically translate nucleotide sequences, nor will it search the translations that can be enabled using the "Nucleotide info" Side Panel palette.
- Position. Find a specific position on the sequence. In order to find an interval, e.g. from position 500 to 570, enter "500..570" in the search field. This will make a selection from position 500 to 570 (both included). Notice the two periods (..) between the start and end number. If you enter positions including thousand separators like 123,345, the comma will just be ignored and it would be equivalent to entering 123345.
Text format
These preferences allow you to adjust the format of all the text in the view (including residue letters, sequence name, and translations if they are shown).
- Text size. Specify a font size for the text in the view.
- Font. Specify a font for the text in the view.
- Bold. Make the text for the residues bold.