Create Dot Plot
Dot plots provide a powerful visual comparison of two sequences. Dot plots can also be used to compare regions of similarity within a sequence.
A dot plot is a simple, yet intuitive way of comparing two sequences, either DNA or protein, and is probably the oldest way of comparing two sequences [Maizel and Lenk, 1981]. A dot plot is a 2 dimensional matrix where each axis of the plot represents one sequence. By sliding a fixed size window over the sequences and making a sequence match by a dot in the matrix, a diagonal line will emerge if two identical (or very homologous) sequences are plotted against each other. Dot plots can also be used to visually inspect sequences for direct or inverted repeats or regions with low sequence complexity. Various smoothing algorithms can be applied to the dot plot calculation to avoid noisy background of the plot. Moreover, various substitution matrices can be applied in order to take the evolutionary distance of the two sequences into account.
To create a dot plot, go to:
Tools | General Sequence Analysis (![]() )| Create Dot Plot (
)| Create Dot Plot (![]() )
)
In the dialog that opens, select a sequence and click Next to adjust dot plot parameters (figure 19.3).
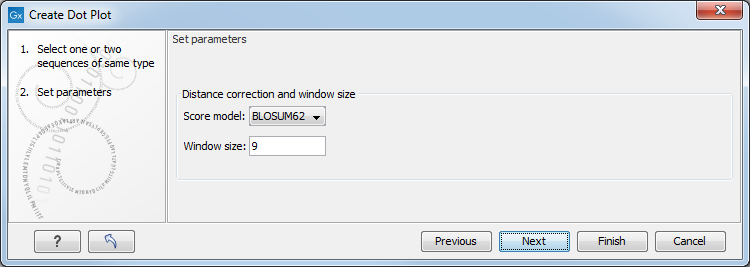
Figure 19.3: Setting the dot plot parameters.
There are two parameters for calculating the dot plot:
- Distance correction (only valid for protein sequences) In order to treat evolutionary transitions of amino acids, a distance correction measure can be used when calculating the dot plot. These distance correction matrices (substitution matrices) take into account the likeliness of one amino acid changing to another.
- Window size A residue by residue comparison (window size = 1) would undoubtedly result in a very noisy background due to a lot of similarities between the two sequences of interest. For DNA sequences the background noise will be even more dominant as a match between only four nucleotide is very likely to happen. Moreover, a residue by residue comparison (window size = 1) can be very time consuming and computationally demanding. Increasing the window size will make the dot plot more 'smooth'.
Note! Calculating dot plots takes up a considerable amount of memory in the computer. Therefore, you will see a warning message if the sum of the number of nucleotides/amino acids in the sequences is higher than 8000. If you insist on calculating a dot plot with more residues the Workbench may shut down, but still allowing you to save your work first. However, this depends on your computer's memory configuration.
Subsections