Result of hierarchical clustering of samples
The result of a sample clustering is shown in figure 27.77.
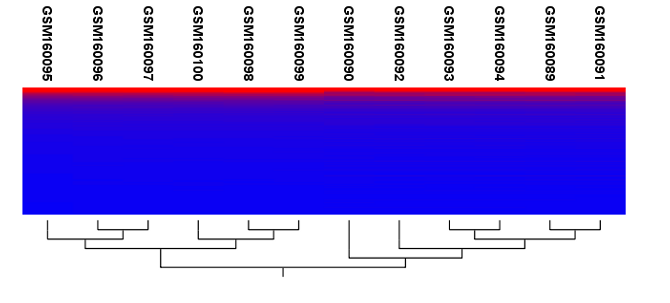
Figure 27.77: Sample clustering.
If you have used an experiment (![]() ) as input, the clustering is added to the experiment and will be saved when you save the experiment. It can be viewed by clicking the Show Heat Map (
) as input, the clustering is added to the experiment and will be saved when you save the experiment. It can be viewed by clicking the Show Heat Map (![]() ) button at the bottom of the view (see figure 27.78).
) button at the bottom of the view (see figure 27.78).
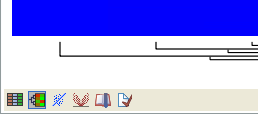
Figure 27.78: Showing the hierarchical clustering of an experiment.
If you have selected a number of samples ( (![]() ) or (
) or (![]() )) as input, a new element will be created that has to be saved separately.
)) as input, a new element will be created that has to be saved separately.
Regardless of the input, the view of the clustering is the same. As you can see in figure 27.77, there is a tree at the bottom of the view to visualize the clustering. The names of the samples are listed at the top. The features are represented as horizontal lines, colored according to the expression level. If you place the mouse on one of the lines, you will see the names of the feature to the left. The features are sorted by their expression level in the first sample (in order to cluster the features, see Hierarchical clustering of features).
Researchers often have a priori knowledge of which samples in a study should be similar (e.g. samples from the same experimental condition) and which should be different (samples from biological distinct conditions). Thus, researches have expectations about how they should cluster. Samples that are placed unexpectedly in the hierarchical clustering tree may be samples that have been wrongly allocated to a group, samples of unintended or unclean tissue composition or samples for which the processing has gone wrong. Unexpectedly placed samples, of course, could also be highly interesting samples.
There are a number of options to change the appearance of the heat map. At the top of the Side Panel, you find the Heat map preference group (see figure 27.79).
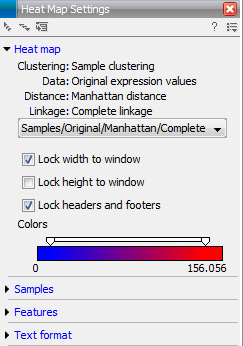
Figure 27.79: Side Panel of heat map.
At the top, there is information about the heat map currently displayed. The information regards type of clustering, expression value used together with distance and linkage information. If you have performed more than one clustering, you can choose between the resulting heat maps in a drop-down box (see figure 27.91).
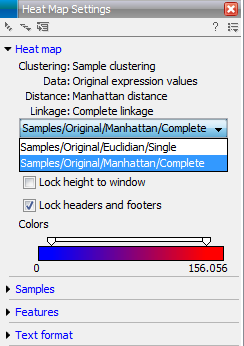
Figure 27.80: When more than one clustering has been performed, there will be a list of heat maps to choose from.
Note that if you perform an identical clustering, the existing heat map will simply be replaced. Below this box, there is a number of settings for displaying the heat map.
- Lock width to window. When you zoom in the heat map, you will per default only zoom in on the vertical level. This is because the width of the heat map is locked to the window. If you uncheck this option, you will zoom both vertically and horizontally. Since you always have more features than samples, it is useful to lock the width since you then have all the samples in view all the time.
- Lock height to window. This is the corresponding option for the height. Note that if you check both options, you will not be able to zoom at all, since both the width and the height is fixed.
- Lock headers and footers. This will ensure that you are always able to see the sample and feature names and the trees when you zoom in.
- Colors. The expression levels are visualized using a gradient color scheme, where the right side color is used for high expression levels and the left side color is used for low expression levels. You can change the coloring by clicking the box, and you can change the relative coloring of the values by dragging the two knobs on the white slider above.
Below you find the Samples and Features groups. They contain options to show names, legend, and tree above or below the heatmap. Note that for clustering of samples, you find the tree options in the Samples group, and for clustering of features, you find the tree options in the Features group. With the tree options, you can also control the Tree size, from tiny to very large, and the option of showing the full tree, no matter how much space it will use.
Note that if you wish to use the same settings next time you open a heat map, you need to save the settings of the Side Panel.