Reporting the results
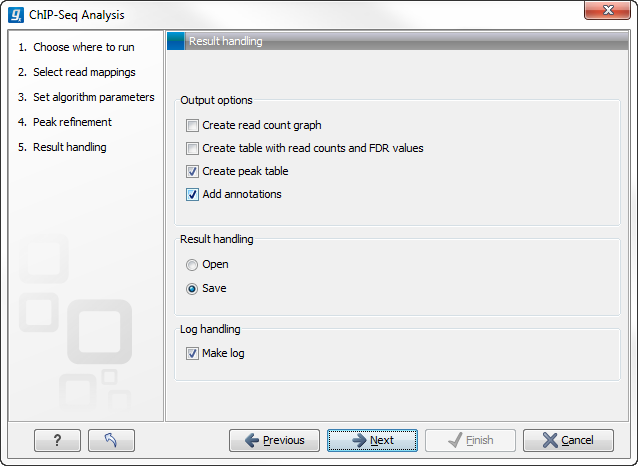
When you click Next, you will be able to specify how the results
should be reported (see figure 29.3).
The different output options are described in detail below. Note, that it is not possible to output a graph and table of read counts in the case where a control sample is used. These options are therefore disabled in this case.
Subsections
- Graph and table of background distribution and false discovery statistics
- Peak table and annotations

