Showing a track in a table
All tracks containing annotations (including variants) can be opened in a table. From the track list this is done either by double-clicking the label of the track or by right-clicking the track and choosing Open This Track. Alternatively, you can open the track from the Navigation Area and switch to the table view (The table will have one row for each annotation, and the columns will reflect its information content. Figure 24.7 shows an example of a variant database track that is presented in a table.
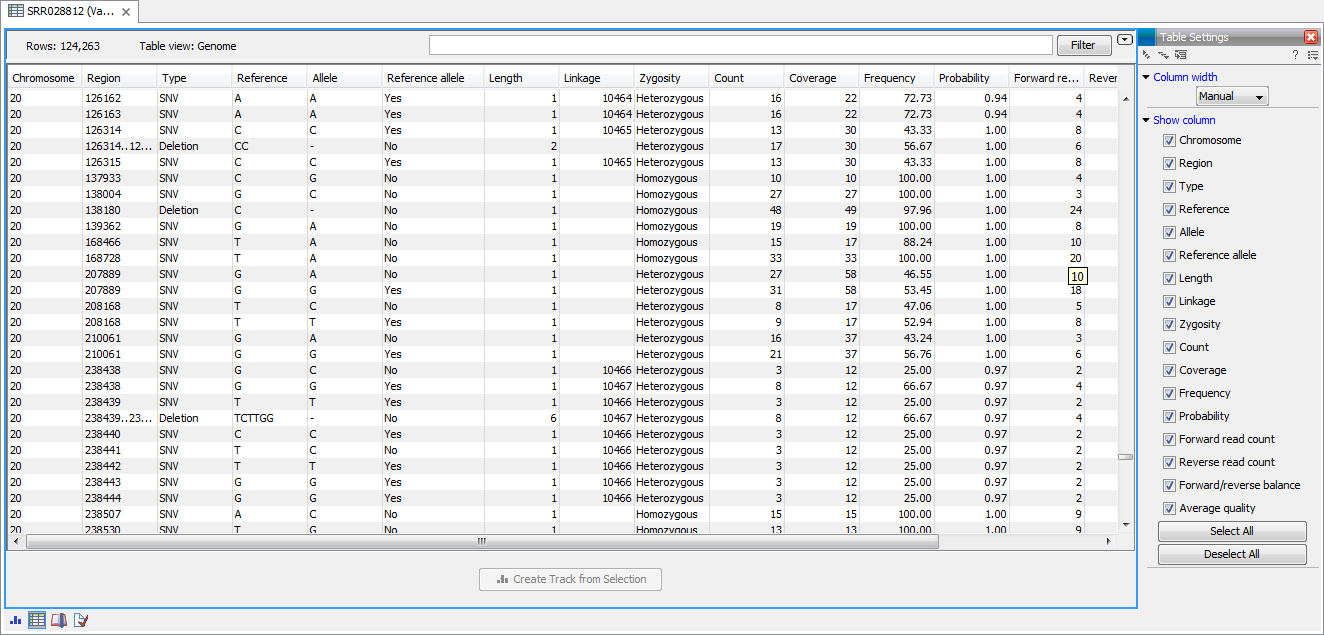
Figure 24.7: Showing a variant track in a table view.
You can use the table to sort, filter and select annotations (see Working with tables). When selecting a row in the table the graphical view will jump to this position on the genome. Please note that table filtering only affects the table. The track itself remains unaffected and keeps all annotations. If you also wish to filter tracks in the graphical view, the Annotate and Filter tools can be used instead.
At the bottom of the table a button to Create Track from Selection is available. This function can be used to create tracks showing only a subset of the data and annotations. Select the relevant rows in the table and click the button to create a new track that only includes the selected subset of the annotations. This function is particularly useful when used in combination with the filter.