Plot of antigenicity
Displaying the antigenicity for a protein sequence in a plot is done in the following way:
select a protein sequence in Navigation Area |
Toolbox in the Menu Bar | Classical Sequence Analysis (![]() ) | Protein Analysis (
) | Protein Analysis (![]() )| Create Antigenicity Plot (
)| Create Antigenicity Plot (![]() )
)
This opens a dialog. The first step allows you to add or remove sequences. Clicking Next takes you through to Step 2, which is displayed in figure 16.9.
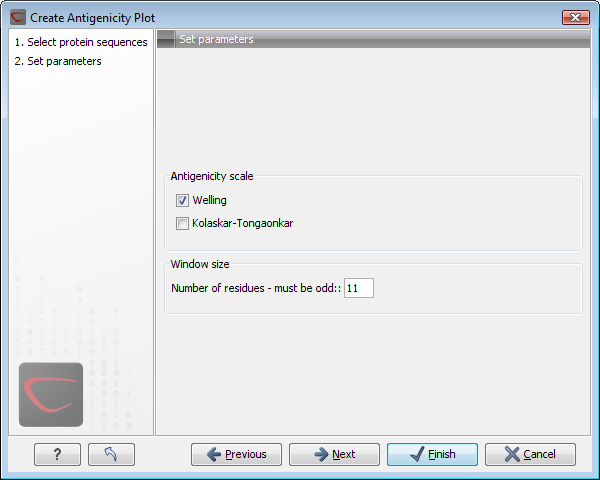
Figure 16.9: Step two in the Antigenicity Plot allows you to choose different antigenicity scales and
the window size.
The Window size is the width of the window where, the antigenicity is calculated. The wider the window, the less volatile the graph. You can chose from a number of antigenicity scales. Click Next if you wish to adjust how to handle the results. If not, click Finish. The resultcan be seen in figure 16.10.
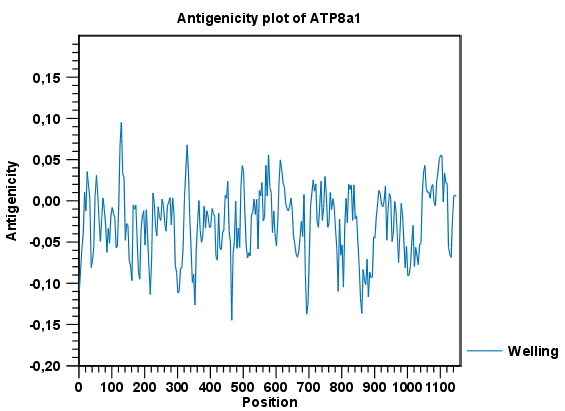
Figure 16.10: The result of the antigenicity plot calculation and the associated
Side Panel.
See Graph preferences for information about the graph view.
The level of antigenicity is calculated on the basis of the different scales. The different scales add different values to each type of amino acid. The antigenicity score is then calculated as the sum of the values in a 'window', which is a particular range of the sequence. The window length can be set from 5 to 25 residues. The wider the window, the less fluctuations in the antigenicity scores.