Per-region statistics
In addition to the summary report, you can see coverage statistics for each
targeted region. This is reported as a track, and you can see the numbers by
going to the table (- Chromosome
- The name is taken from the reference sequence used for mapping.
- Region
- The region of the
- Name
- The annotation name derived from the annotation (if there is additional information on the annotation, this is retained in this table as well).
- Length
- The length of the region.
- Length covered
- The length of the region that is covered by at least the Minimum coverage level provided in figure 26.1.
- Read count
- Number of reads that cover this region. Note that reads that only cover the region partially are also included.
- Base count
- The number of bases in the reads that are covering the target region.
- %GC
- The GC content of the region.
- Minimum coverage
- The lowest coverage in the region.
- Maximum coverage
- The highest coverage in the region.
- Mean coverage
- The average coverage in the region. There are two numbers: one for the full region and one excluding any zero-coverage parts of the region.
- Median coverage
- The median coverage in the region. There are two numbers: one for the full region and one excluding any zero-coverage parts of the region.
- Zero coverage bases
- The number of positions with no coverage.
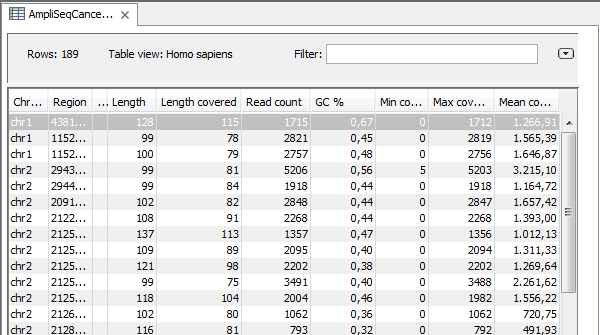
Figure 26.4: The table output with detailed information on each region.