Coverage summary report
An example of a coverage report is shown in figure 26.3)
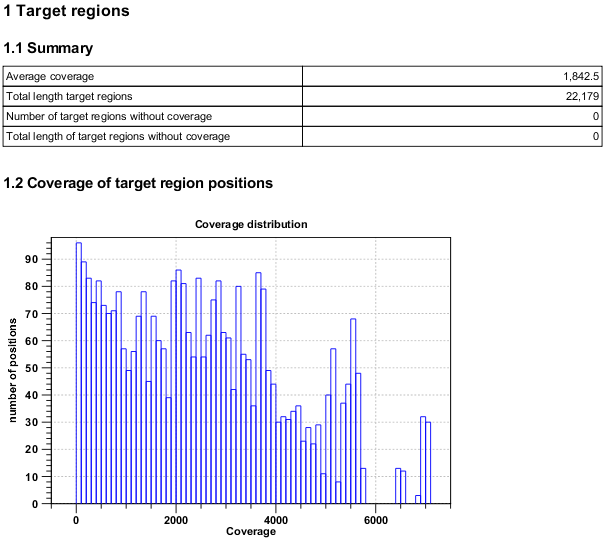
Figure 26.3: The report with overviews of mapped reads.
This figure show the top of the report. The full content is explained below:
- Coverage summary
- This table shows overall coverage information.
- Average coverage
- The average coverage across all the targeted regions.
- Total length of target regions
- The sum of the size of all the targeted regions (this means it is calculated from the annotations alone and is not influenced by the reads).
- Number of target regions with low coverage
- Number of target regions where at least parts of the regions have coverage below the threshold specified.
- Total length of target regions with low coverage
- The total length of these regions.
- Fractions of targets with low coverage
- This table shows how many target regions have a certain percentage of the region above the low coverage threshold.
- Coverage of target regions positions
- This plot shows the coverage level on the x axis, and the number of positions in the target regions with that coverage level.
- Minimum coverage of target regions
- This shows the percentage of the targeted regions that are covered by this many reads. The intervals can be specified in the dialog when running the analysis. Default is 1, 5, 10, 20, 40, 80, 100 times. In figure 26.3 this means that 81.11 % of the positions on the target are covered by at least 40 reads.
- Targeted regions overview
- For each reference sequence, the following information is displayed:
- Reference
- The name of the reference sequence.
- Total mapped reads
- The total number of mapped reads on the reference, including reads mapped outside the target regions.
- Mapped reads in targeted region
- Total number of reads in the targeted regions. Note that if there are overlapping regions, reads covered by two regions will be counted twice. If a read is only partially inside a targeted region, it will still count as a full read.
- Specificity
- The percentage of the total mapped reads that are in the targeted regions.
- Base coverage
- This table and corresponding graph is similar to the table at the top of the report. It shows for each fold of the mean coverage (0.1 to 1.0) how many bases of the targeted regions are covered. Because this is based on mean coverage, the numbers can be used for cross-sample comparison of the quality of the experiment. In addition to the table, a plot shows the relationship between fold mean coverage and the number of positions.
- Mean coverage per target position
- Three plots listing the mean coverage for each position of the targeted regions. The first plot shows coverage across the whole target, using a percentage of the target length on the x axis (to make it possible to have targets with different lengths in the same plot). This is reported for reverse and forward reads as well. In addition, there are two plots showing the same but with base positions on the x axis counting from the start and end of the target regions, respectively. These plots can be used to evaluate whether there is a general tendency towards lower coverage at the end of the targeted region, and whether there is a bias in terms of forward and reverse reads coverage.
- Read count per %GC
- The plot shows the GC content of the reference sequence on the X-axis and the number of mapped reads on the Y-axis. This plot will show if there is a basis caused by higher GC-content in the sequence.