Zooming and navigating track views
It is possible to zoom in and out on the view shown in 24.1 with the zoom tools in the right-hand corner of the Toolbar, or by using a mouse scroll wheel while pressing the Ctrl (When zooming in and out you will see that, when zoomed out, the data is visualized in an aggregated format using a density bar plot or a graph. This allows you to navigate the view more smoothly and get an overview of e.g. how many SNPs are located in a certain region.
In figure 24.2 we have zoomed in on a specific region with a read track at the top showing the individual reads and with CDS and SNP annotations shown below.
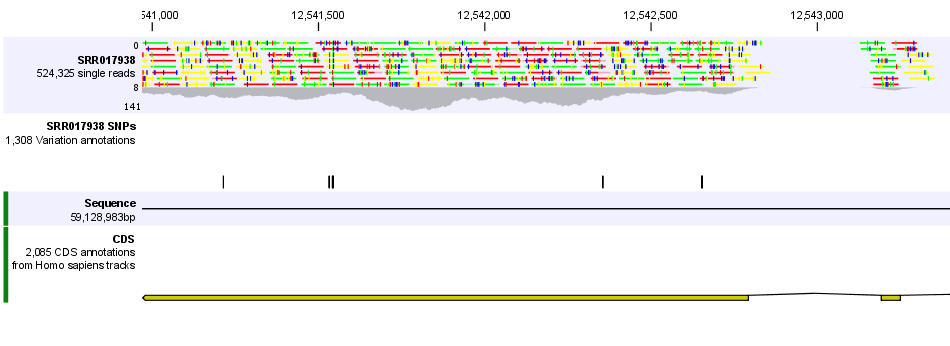
Figure 24.2: Zooming in on the tracks reveals details
If you zoom in further the alignment of the reads and the reference sequence can be viewed at single nucleotide level (see figure 24.3).
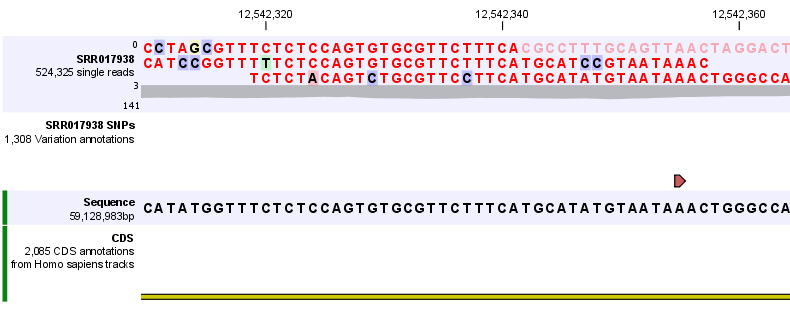
Figure 24.3: Zoom in to see the bases of the reads and the reference sequence.
In this case only three reads are visible. In order to see more reads, increase the height of the reads track by dragging down the lower part of the track with the mouse (Figure 24.4).
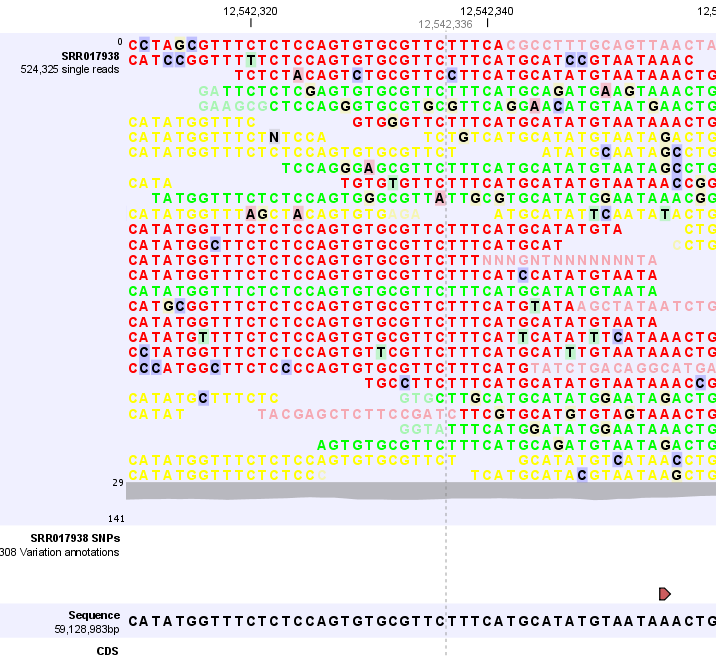
Figure 24.4: Adjusting the height of the track.
The options for the Side Panel vary depending on which track is shown in the View Area. In figure 24.5 an example is shown for a read mapping:
- Navigation.
- Gives information about which chromosome is currently shown. Below this, you can see the start and end positions of the shown region of the chromosome. The drop-down list can be used to jump to a different chromosome. It is also possible to jump to a new position. This can be done by typing in the start and end positions in the text fields. The selected region will automatically appear in the viewing area.
- Insertions.
- Only relevant for variant tracks.
- Find.
- Not relevant for reads tracks.
- Track layout.
- The options for the Track layout varies depending on which track type is shown. The options for a read track are:
- Data aggregation. Allows you to specify whether the information in the track should be shown in detail or whether you wish to aggregate data. By aggregating data you decrease the detail level but increase the speed of the data display process, which is of particular interest when working with big data sets. The threshold (in bp) for when data should be aggregated can be specified with the drop-down box. The threshold describes the unit (or "bucket") size in base pairs, above which the data will start being aggregated. The bucket size depends on the track length and the zoom level. Hence, a data aggregation threshold with a low value will only show details when zoomed in, whereas a high value means that you can see details even when zoomed out. Please note that when using the high values, it will take longer time to display the data on the screen. Figure 24.5 shows the options for a read track and an annotation track. The data aggregation settings can be adjusted for each displayed track type.
- Graph color. Makes it possible to change the graph color.
- Hide insertions below (%). Hides insertions where the percentage of reads containing insertions is below this value.
- Highlight variants. Variants are highlighted
- Float variant reads to top. When checked, reads with variations will appear at the top of the view.
- Disconnect pairs. Disconnects paired end reads.
- Show quality scores. Shows the quality score. Ticking this option makes it possible to adjust the colors of the residues based on their quality scores. A quality score of 20 is used as default and will show all residues with a quality score of 20 or below in a blue color. Residues with quality scores above 20 will have colors that correspond to the selected color code. In this case residues with high quality scores will be shown in reddish colors. Clicking once on the color bar makes it possible to adjust the colors. Double clicking on the slider makes it possible to adjust the quality score limits. In cases where no quality scores are available, blue (the color normally used for residues with a low quality score) is used as default color for such residues.
- Matching residues as dots. Replaces matching residues with dots, only variants are shown in letters.
- Show read type specific coverage. When enabled, the coverage graph that summarizes those reads that could not be explicitly shown is now replaced by one coverage graph for each read type found in the Reads track. This could for instance be used for easy and visual comparison of the strand specific coverage.
- Only show coverage graph. When enabled, only the coverage graph is shown and no reads are shown.
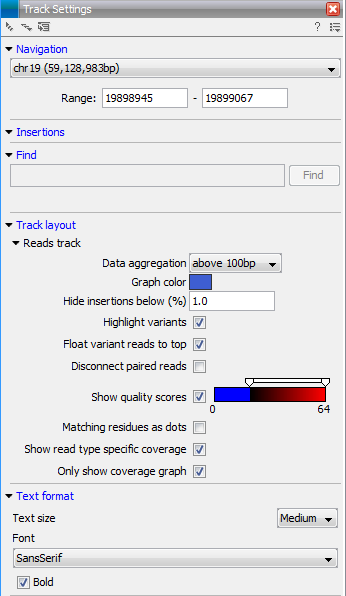
Figure 24.5: The Side Panel for reads tracks.