Method
The local realignment algorithm uses a variant of the approach described by Homer et al. [Homer N, 2010].
In the first step, alignment information of all input reads are collected in an efficient graph-based data structure, which is essentially similar to a de-Brujn graph. This realignment graph represents how reads are aligned to the reference sequence and how reads overlap each other. In the second step, metadata are derived from the graph structure that indicate at which alignment positions realignment could potentially improve the read mapping, and also provides hypotheses as to how reads should be realigned to yield the most concise multiple alignment. In the third step the realignment graph and its metadata are used to actually perform the local realignment of each individual read. Figure 25.28 depicts a partial realignment graph for the read mapping shown in figure 25.27.
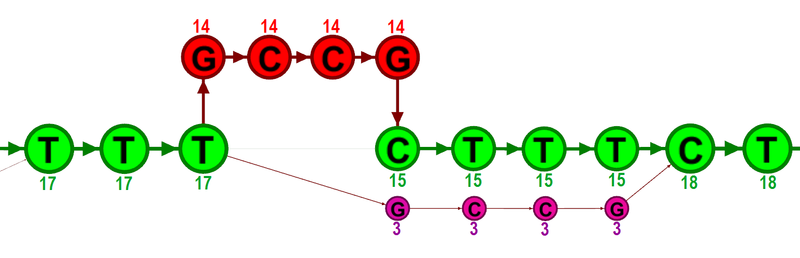
Figure 25.28: The green nodes represent nucleotides of the reference sequence. The four red nodes represent the four-nucleotide insertion observed in fourteen mapped reads. The four violet nodes represent the four mismatches to the reference sequence observed in three mapped reads. During realignment of the original reads, two possible paths through the graph are discovered. One path leads through the four red nodes, the other through the four violet nodes. Since red nodes have been observed in fourteen of the original reads, whereas the violet nodes have only been seen in three original reads, the path through the four red nodes is preferred over the path through the violet nodes.