View dot plots
A view of a dot plot can be seen in figure 14.7.
You can select Zoom in (![]() ) in the Toolbar and click
the dot plot to zoom in to see the details of particular areas.
) in the Toolbar and click
the dot plot to zoom in to see the details of particular areas.
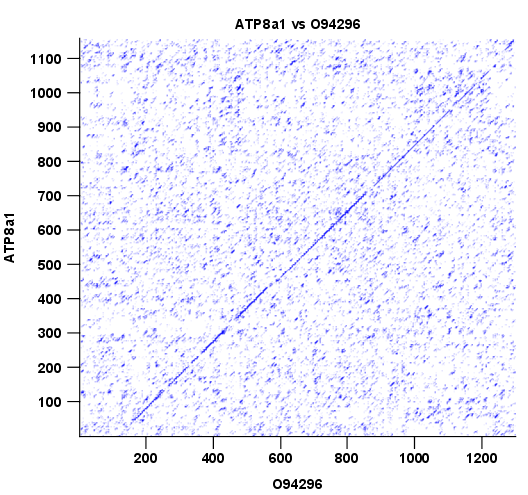
Figure 14.7: A view is opened showing the dot plot.
The Side Panel to the right let you specify the dot plot preferences. The gradient color box can be adjusted to get the appropriate result by dragging the small pointers at the top of the box. Moving the slider from the right to the left lowers the thresholds which can be directly seen in the dot plot, where more diagonal lines will emerge. You can also choose another color gradient by clicking on the gradient box and choose from the list.
Adjusting the sliders above the gradient box is also practical, when producing an output for printing. (Too much background color might not be desirable). By crossing one slider over the other (the two sliders change side) the colors are inverted, allowing for a white background. (If you choose a color gradient, which includes white). Se figure 14.7.
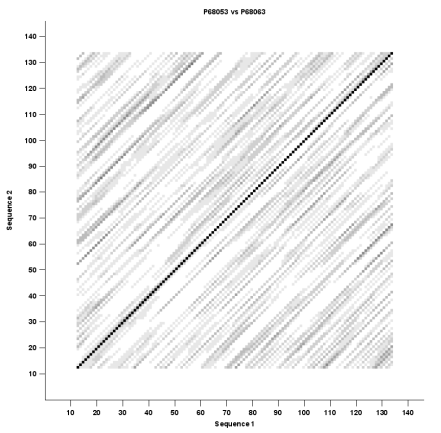
Figure 14.8: Dot plot with inverted colors, practical for printing.