Creating graph tracks
Graph tracks can be created from sequences and mappings using the tools in the Toolbox:
Toolbox | Track Tools (![]() ) | Graphs
) | Graphs
Graph tracks can also be created directly from the track view or track list view by right-clicking the track you wish to use as input, which will give access to the toolbox.
The Create GC Contents Graph Track tool needs a sequence track as input and will create a graph track with the GC contents of that sequence. This track can then be displayed together with the sequence and other tracks in a track list.
The Create Mapping Graph Tracks can create the following graphs from a mapping track (see figure 24.24).
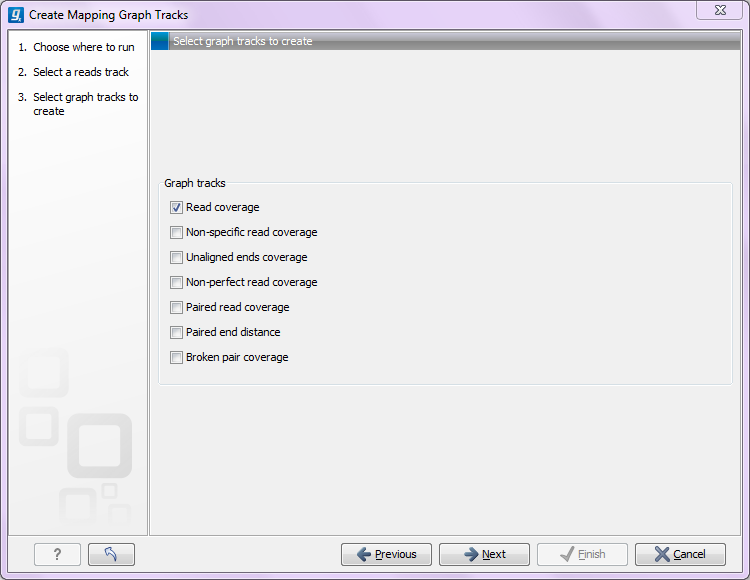
Figure 24.1: Creating graph track from mappings.
- Read coverage. For each position this graph shows the number of reads contributing to the alignment (see a more elaborate definition in Reference sequence statistics).
- Non-specific read coverage. Non-specific reads are reads that would fit equally well other places in the reference genome.
- Unaligned ends coverage. Un-aligned ends arise when a read has been locally aligned to a reference sequence, and then end of the read is left unaligned because there are mismatches or gaps relative to the reference sequence. This part of the read does not contribute to the read coverage above. The unaligned ends coverage graph shows how many reads that have unaligned ends at each position.
- Non-perfect read coverage. Non-perfect reads are reads with one or more mismatches or gaps relative to the reference sequence.
- Paired read coverage. This lists the coverage of intact pairs. If there are no single reads and no pairs are broken, it will be the same as the standard read coverage above.
- Broken pair coverage. A pair is broken either because only one read in the pair matches, or because the distance or relative orientation between the reads is wrong.
- Paired end distance. Displays the average distance between the forward and the reverse read in a pair. A pair contributes to this graph from the beginning of the first read to the end of the second read.
The Identify Graph Threshold Areas tool uses graph tracks as input to identify graph regions that fall within certain limits (thresholds). The lower and upper thresholds are to be specified by the user (figure 24.25). In cases where a mapping graph track has been used as input, the range for the lower and upper thresholds will depend on the type of graph that was created from the mapping track as well as on the data (coverage, quality etc.).
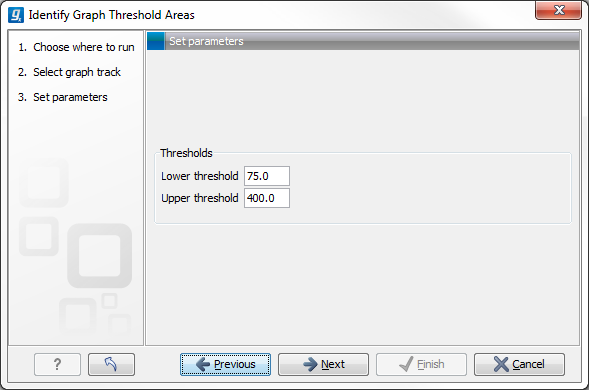
Figure 24.2: Specification of lower and upper thresholds.
When zoomed out, the graph tracks are composed of three curves showing the maximum, mean, and minimum value observed in a given region (see figure 24.26). When zoomed in only one curve will be shown reflecting the exact observation at each individual position.
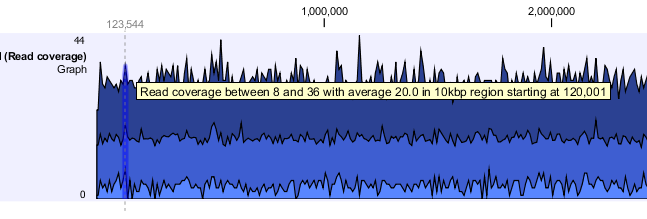
Figure 24.3: Graph track showing the minimum, mean, and maximum observed values. At the highlighted position the minimum value is 8, the mean value 20 and the maximum value 36.