Hypergeometric tests on annotations
The first approach to using annotations to extract biological information is the hypergeometric annotation test. This test measures the extend to which the annotation categories of features in a smaller gene list, 'A', are over or under-represented relative to those of the features in larger gene list 'B', of which 'A' is a sub-list. Gene list B is often the features of the full experiment, possibly with features which are thought to represent only noise, filtered away. Gene list A is a sub-experiment of the full experiment where most features have been filtered away and only those that seem of interest are kept. Typically gene list A will consist of a list of candidate differentially expressed genes. This could be the gene list obtained after carrying out a statistical analysis on the experiment, and keeping only features with FDR corrected p-values <0.05 and a fold change which is larger than 2 in absolute value. The hyper geometric test procedure implemented is similar to the unconditional GOstats test of [Falcon and Gentleman, 2007].
Toolbox | Transcriptomics Analysis (![]() )| Annotation Test | Hypergeometric Tests on Annotations (
)| Annotation Test | Hypergeometric Tests on Annotations (![]() )
)
This will show a dialog where you can select the two experiments - the larger experiment, e.g. the original experiment including the full list of features - and a sub-experiment (see how to create a sub-experiment in Creating sub-experiment from selection).
Click Next. This will display the dialog shown in figure 27.95.
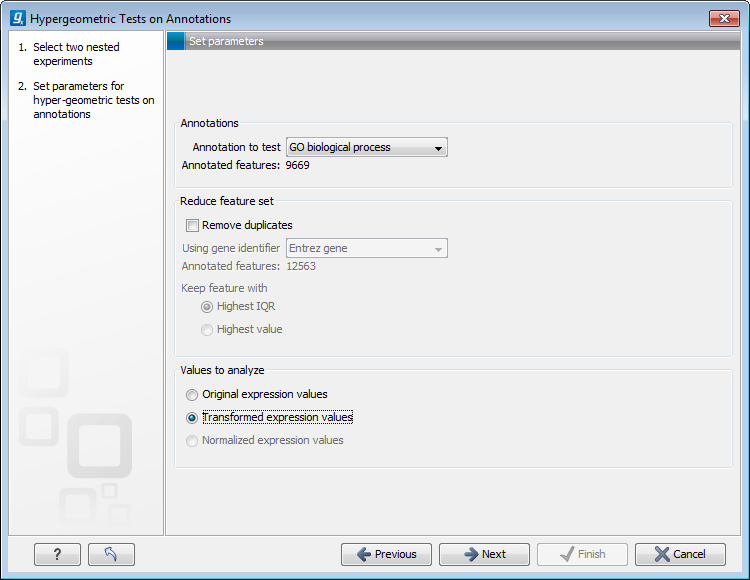
Figure 27.95: Parameters for performing a hypergeometric test on annotations
At the top, you select which annotation to use for testing. You can select from all the annotations available on the experiment, but it is of course only a few that are biologically relevant. Once you have selected an annotation, you will see the number of features carrying this annotation below.
Annotations are typically given at the gene level. Often a gene is represented by more than one feature in an experiment. If this is not taken into account it may lead to a biased result. The standard way to deal with this is to reduce the set of features considered, so that each gene is represented only once. In the next step, Remove duplicates, you can choose how you want this to be done:
- Using gene identifier.
- Keep feature with:
- Highest IQR. The feature with the highest interquartile range (IQR) is kept.
- Highest value. The feature with the highest expression value is kept.
At the bottom, you can select which values to analyze (see Selecting transformed and normalized values for analysis).
Click Next if you wish to adjust how to handle the results. If not, click Finish.
Subsections