Restriction site analysis from the Toolbox
Besides the dynamic restriction sites, you can do a more elaborate
restriction map analysis with more output format using the Toolbox:
Toolbox | Molecular Biology Tools (![]() ) | Cloning and Restriction Sites (
) | Cloning and Restriction Sites (![]() )| Restriction Site Analysis (
)| Restriction Site Analysis (![]() )
)
This will display the dialog shown in figure 19.39.
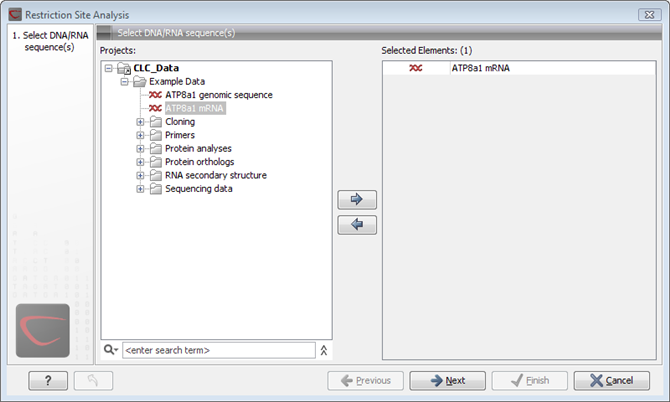
Figure 19.39: Choosing sequence ATP8a1 mRNA for restriction map analysis.
If a sequence was selected before choosing the Toolbox action, this sequence is now listed in the Selected Elements window of the dialog. Use the arrows to add or remove sequences or sequence lists from the selected elements.
Subsections
- Selecting, sorting and filtering enzymes
- Number of cut sites
- Output of restriction map analysis
- Restriction sites as annotation on the sequence
- Table of restriction sites
- Table of restriction fragments
- Gel