Running the Coverage analysis tool
To run the Coverage analysis tool:
Toolbox | Resequencing Analysis (![]() ) |
Coverage Analysis (
) |
Coverage Analysis (![]() )
)
This opens the dialog shown in figure 25.36.
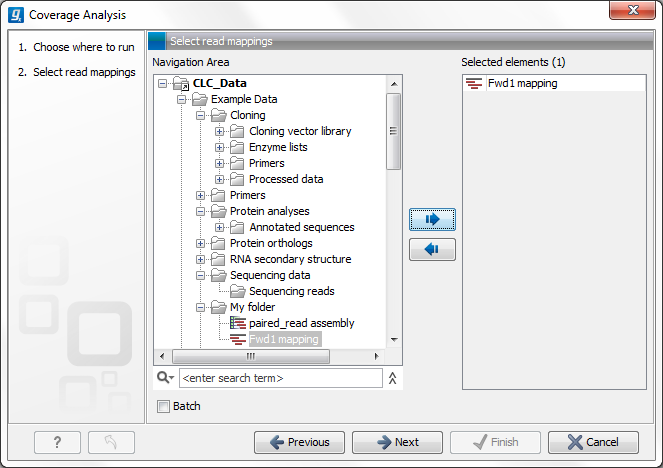
Figure 25.36: Select read mapping results.
Select a reads track or read mapping and click Next. This opens the dialog shown in figure 25.37.
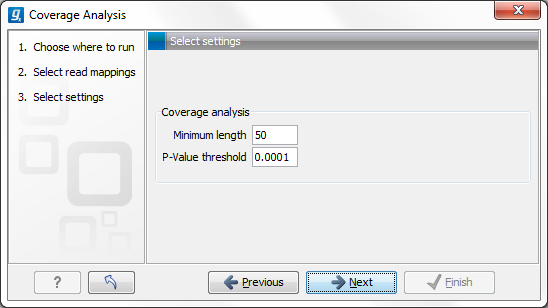
Figure 25.37: Specify the p-value cutoff.
Set the p-value and minimum length cutoff.
Click Next and specify the result handling (figure 25.38).
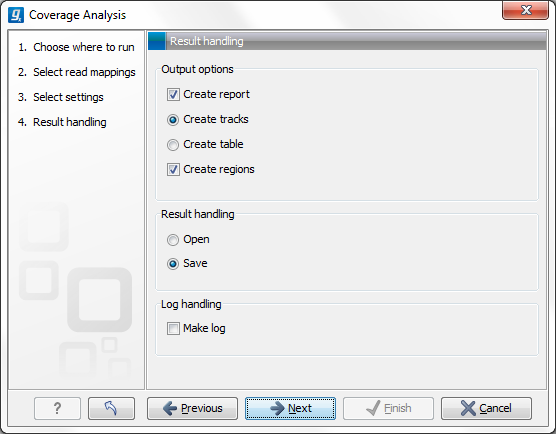
Figure 25.38: Specify the output.
Open or save and click Finish.
An example of a track output of the Coverage analysis tool is shown in figure 25.39.
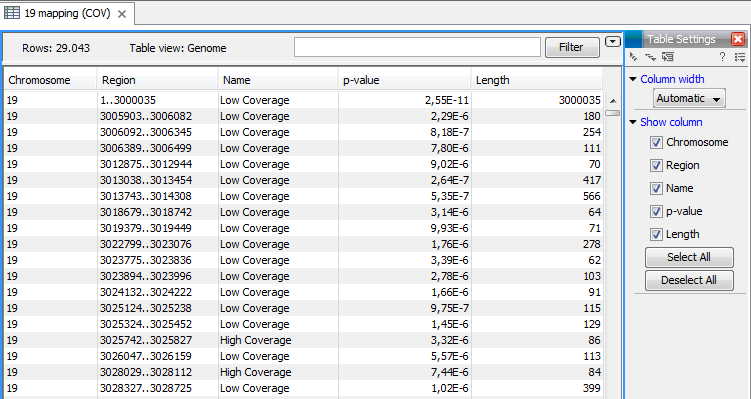
Figure 25.39: An example of a track output of the Coverage analysis tool.