Examples and interpretations of dot plots
Contrary to simple sequence alignments dot plots can be a very useful tool for spotting various evolutionary events which may have happened to the sequences of interest.
Below is shown some examples of dot plots where sequence insertions, low complexity regions, inverted repeats etc. can be identified visually.
Similar sequences
The most simple example of a dot plot is obtained by plotting two homologous sequences of interest. If very similar or identical sequences are plotted against each other a diagonal line will occur.
The dot plot in figure 14.9 shows two related sequences of the Influenza A virus nucleoproteins infecting ducks and chickens. Accession numbers from the two sequences are: DQ232610 and DQ023146. Both sequences can be retrieved directly from http://www.ncbi.nlm.nih.gov/gquery/gquery.fcgi.
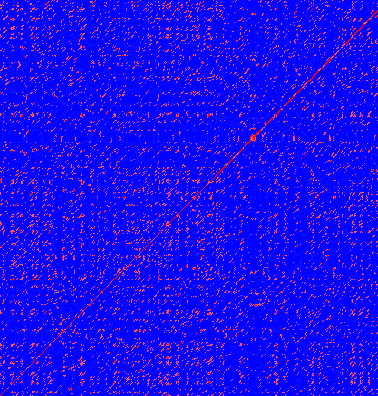
Figure 14.9: Dot plot of DQ232610 vs. DQ023146 (Influenza A virus nucleoproteins)
showing and overall similarity
Repeated regions
Sequence repeats can also be identified using dot plots. A repeat region will typically show up as lines parallel to the diagonal line.
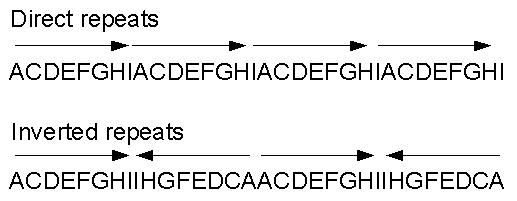
Figure 14.10: Direct and inverted repeats shown on an amino acid sequence generated for demonstration purposes.
If the dot plot shows more than one diagonal in the same region of a sequence, the regions depending to the other sequence are repeated. In figure 14.11 you can see a sequence with repeats.

Figure 14.11: The dot plot of a sequence showing repeated elements. See also figure 14.10.
Frame shifts
Frame shifts in a nucleotide sequence can occur due to insertions, deletions or mutations. Such frame shifts can be visualized in a dot plot as seen in figure 14.12. In this figure, three frame shifts for the sequence on the y-axis are found.
- Deletion of nucleotides
- Insertion of nucleotides
- Mutation (out of frame)

Figure 14.12: This dot plot show various frame shifts in the sequence. See text for details.
Sequence inversions
In dot plots you can see an inversion of sequence as contrary diagonal to the diagonal showing similarity. In figure 14.13 you can see a dot plot (window length is 3) with an inversion.
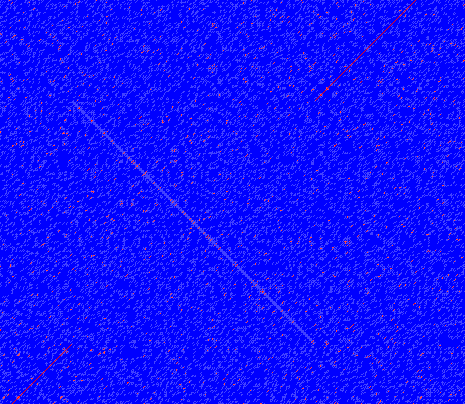
Figure 14.13: The dot plot showing a inversion in a sequence. See also figure 14.10.
Low-complexity regions
Low-complexity regions in sequences can be found as regions around the diagonal all obtaining a high score. Low complexity regions are calculated from the redundancy of amino acids within a limited region [Wootton and Federhen, 1993]. These are most often seen as short regions of only a few different amino acids. In the middle of figure 14.14 is a square shows the low-complexity region of this sequence.

Figure 14.14: The dot plot showing a low-complexity region in the sequence.
The sequence is artificial and low complexity regions does not always show as a square.