Proteolytic cleavage parameters
Given a protein sequence, CLC Genomics Workbench detects proteolytic cleavage sites in accordance with detection parameters and shows the detected sites as annotations on the sequence and in textual format in a table below the sequence view.
Detection of proteolytic cleavage sites is initiated by:
right-click a protein sequence in Navigation Area
| Toolbox | Classical Sequence Analysis (![]() ) | Protein Analysis (
) | Protein Analysis (![]() )|
Proteolytic Cleavage, (
)|
Proteolytic Cleavage, (![]() )
)
This opens the dialog shown in figure 16.23:
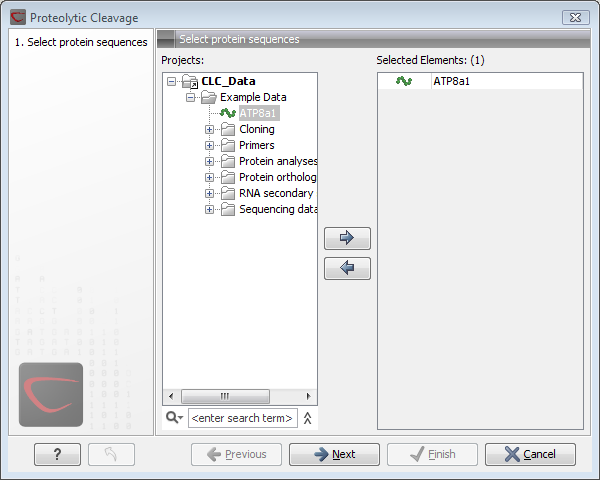
Figure 16.23: Choosing sequence CAA32220 for proteolytic cleavage.
CLC Genomics Workbench allows you to detect proteolytic cleavages for several sequences at a time. Correct the list of sequences by selecting a sequence and clicking the arrows pointing left and right. Then click Next to go to Step 2.
In Step 2 you can select proteolytic cleavage enzymes. The list of available enzymes will be expanded continuously. Presently, the list contains the enzymes shown in figure 16.24. The full list of enzymes and their cleavage patterns can be seen in Appendix.
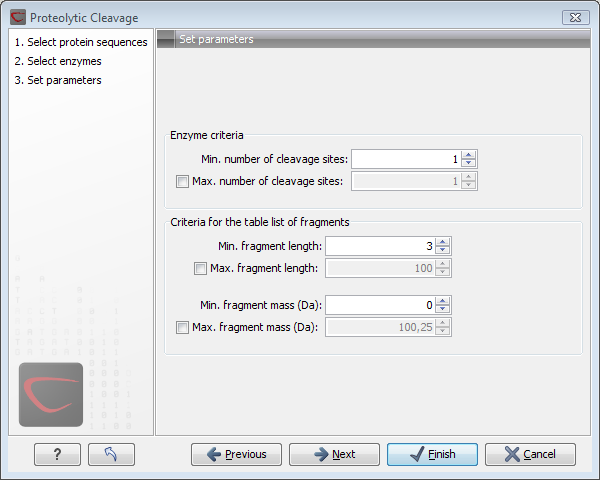
Figure 16.24: Setting parameters for proteolytic cleavage detection.
Select the enzymes you want to use for detection. When the relevant enzymes are chosen, click Next.
In Step 3 you can set parameters for the detection. This limits the number of detected cleavages. Figure 16.25 shows an example of how parameters can be set.
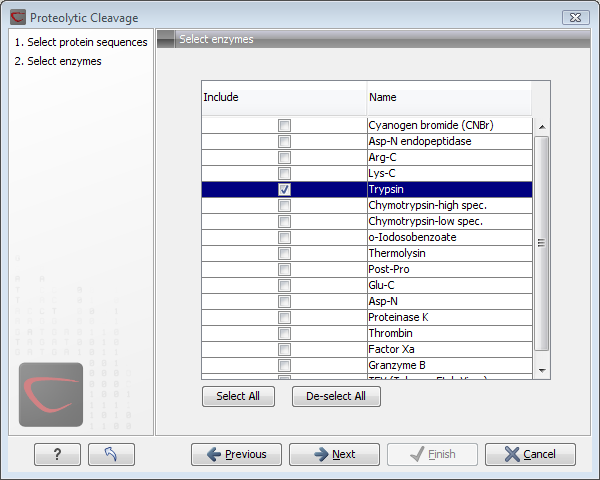
Figure 16.25: Setting parameters for proteolytic cleavage detection.
- Min. and max. number of cleavage sites. Certain proteolytic enzymes cleave at many positions in the amino acid sequence. For instance proteinase K cleaves at nine different amino acids, regardless of the surrounding residues. Thus, it can be very useful to limit the number of actual cleavage sites before running the analysis.
- Min. and max. fragment length Likewise, it is possible to limit the output to only display sequence fragments between a chosen length. Both a lower and upper limit can be chosen.
- Min. and max. fragment mass
The molecular weight is not necessarily directly correlated to the
fragment length as amino acids have different molecular masses. For
that reason it is also possible to limit the search for proteolytic
cleavage sites to mass-range.
Example!: If you have one protein sequence but you only want to show which enzymes cut between two and four times. Then you should select "The enzymes has more cleavage sites than 2" and select "The enzyme has less cleavage sites than 4". In the next step you should simply select all enzymes. This will result in a view where only enzymes which cut 2,3 or 4 times are presented.
Click Next if you wish to adjust how to handle the results. If not, click Finish.
The result of the detection is displayed in figure 16.26.
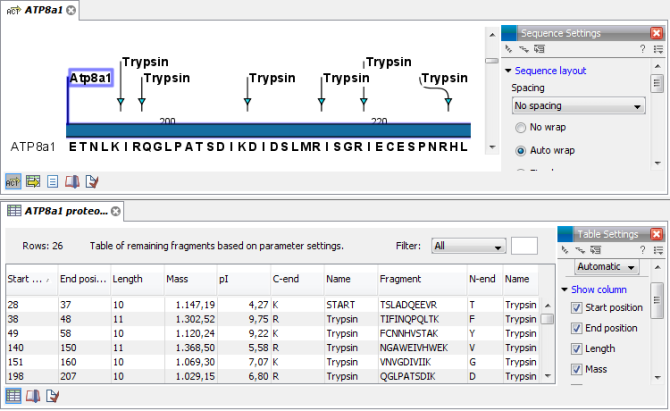
Figure 16.26: The result of the proteolytic cleavage detection.
Depending on the settings in the program, the output of the proteolytic cleavage site detection will display two views on the screen. The top view shows the actual protein sequence with the predicted cleavage sites indicated by small arrows. If no labels are found on the arrows they can be enabled by setting the labels in the "annotation layout" in the preference panel. The bottom view shows a text output of the detection, listing the individual fragments and information on these.