Histogram
A histogram shows a distribution of a set of values. Histograms are often used for examining and comparing distributions, e.g. of expression values of different samples, in the quality control step of an analysis.
You can create a histogram showing the distribution of expression value for a sample:
Toolbox | Transcriptomics Analysis (![]() )| General Plots | Create Histogram (
)| General Plots | Create Histogram (![]() )
)
Select a number of samples ( (![]() ) or (
) or (![]() )) or a graph track. When you have selected more than one sample, a histogram will be created for each one. Clicking Next will display a dialog as shown in figure 27.100.
)) or a graph track. When you have selected more than one sample, a histogram will be created for each one. Clicking Next will display a dialog as shown in figure 27.100.
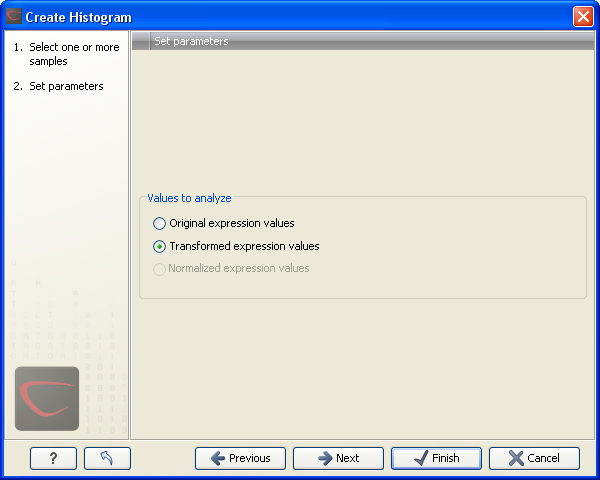
Figure 27.100: Selcting which values the histogram should be based on.
In this dialog, you select the values to be used for creating the histogram (see Selecting transformed and normalized values for analysis).
Click Next if you wish to adjust how to
handle the results. If not, click Finish.
Subsections