Protein report output
An example of Protein report can be seen in figure 16.20.
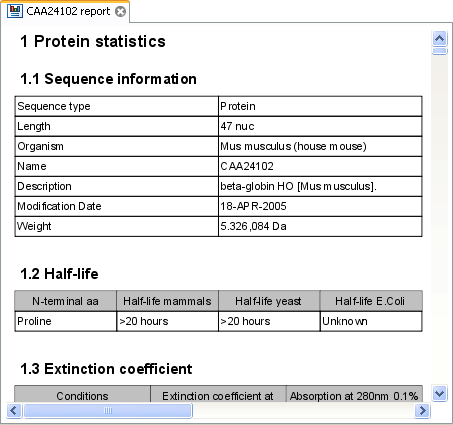
Figure 16.20: A protein report. There is a Table of Contents in the Side Panel that makes it easy to
browse the report.
By double clicking a graph in the output, this graph is shown in a different view (CLC Genomics Workbench generates another tab). The report output and the new graph views can be saved by dragging the tab into the Navigation Area.
The content of the tables in the report can be copy/pasted out of the program and e.g. into Microsoft Excel. To do so:
Select content of table | Right-click the selection | Copy
You can also Export (![]() ) the report in Excel format.
) the report in Excel format.