Hydrophobicity graphs along sequence
Hydrophobicity graphs along sequence can be displayed easily by activating the calculations from the Side Panel for a sequence.
right-click protein sequence in Navigation Area | Show | Sequence | open Protein info in Side Panel
or double-click protein sequence in Navigation Area | Show | Sequence | open Protein info in Side Panel
These actions result in the view displayed in figure 16.13.
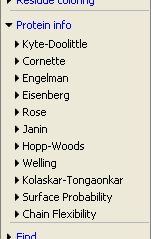
Figure 16.13: The different available scales in Protein info in CLC Genomics Workbench.
The level of hydrophobicity is calculated on the basis of the different scales. The different scales add different values to each type of amino acid. The hydrophobicity score is then calculated as the sum of the values in a 'window', which is a particular range of the sequence. The window length can be set from 5 to 25 residues. The wider the window, the less fluctuations in the hydrophobicity scores. (For more about the theory behind hydrophobicity, see Bioinformatics explained: Protein hydrophobicity ).
In the following we will focus on the different ways that CLC Genomics Workbench offers to display the hydrophobicity scores. We use Kyte-Doolittle to explain the display of the scores, but the different options are the same for all the scales. Initially there are three options for displaying the hydrophobicity scores. You can choose one, two or all three options by selecting the boxes. (See figure 16.14).
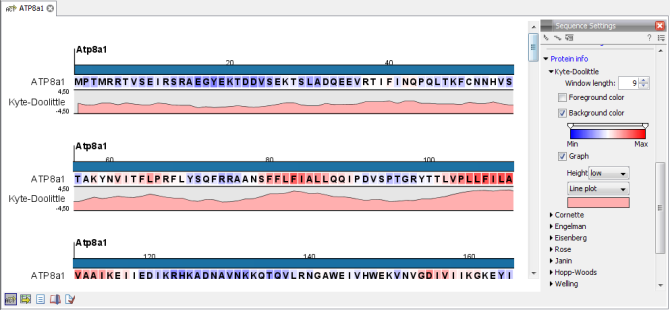
Figure 16.14: The different ways of displaying the hydrophobicity scores, using the Kyte-Doolittle
scale.
Coloring the letters and their background. When choosing coloring of letters or coloring of their background, the color red is used to indicate high scores of hydrophobicity. A 'color-slider' allows you to amplify the scores, thereby emphasizing areas with high (or low, blue) levels of hydrophobicity. The color settings mentioned are default settings. By clicking the color bar just below the color slider you get the option of changing color settings.
Graphs along sequences. When selecting graphs, you choose to display the hydrophobicity scores underneath the sequence. This can be done either by a line-plot or bar-plot, or by coloring. The latter option offers you the same possibilities of amplifying the scores as applies for coloring of letters. The different ways to display the scores when choosing 'graphs' are displayed in figure 16.14. Notice that you can choose the height of the graphs underneath the sequence.