Gene-level expression
When you open the result of an RNA-Seq analysis, it starts in the gene-level view as shown in figure 27.12.
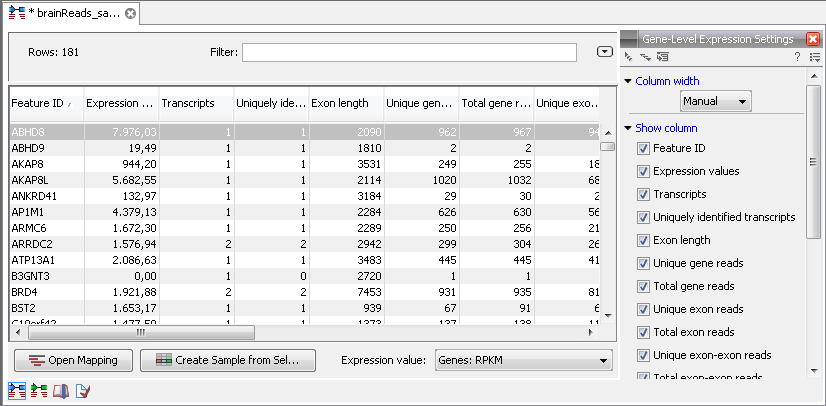
Figure 27.12: A subset of a result of an RNA-Seq analysis on the gene level. Not all columns are shown in this figure
The table summarizes the read mappings that were obtained for each gene (or reference). The following information is available in this table:
- Feature ID. This is the name of the gene.
- Expression values. This is based on the expression measure chosen in figure 27.9.
- Transcripts annotated. The number of transcripts based on the mRNA annotations on the reference. Note that this is not based on the sequencing data - only on the annotations already on the reference sequence(s).
- Detected transcripts. The number of transcripts which have reads assigned (see the description of transcript-level expression below).
- Exon length. The total length of all exons (not all transcripts).
- Unique gene reads. This is the number of reads that match uniquely to the gene.
- Total gene reads. This is all the reads that are mapped to this gene -- both reads that map uniquely to the gene and reads that matched to more positions in the reference (but fewer than the 'Maximum number of hits for a read' parameter) which were assigned to this gene.
- Unique exon reads. The number of reads that match uniquely to the exons (including the exon-exon and exon-intron junctions).
- Total exon reads. Number of reads mapped to this gene that fall entirely within an exon or in exon-exon or exon-intron junctions. As for the 'Total gene reads' this includes both uniquely mapped reads and reads with multiple matches that were assigned to an exon of this gene.
- Ration of unique to total (exon reads). The ratio of the unique reads to the total number of reads in the exons. This can be convenient for filtering the results to exclude the ones where you have low confidence because of a relatively high number of non-unique exon reads.
- Unique exon-exon reads. Reads that uniquely match across an exon-exon junction of the gene (as specified in figure 27.13). The read is only counted once even though it covers several exons.
- Total exon-exon reads. Reads that match across an exon-exon junction of the gene (as specified in figure 27.13). As for the 'Total gene reads' this includes both uniquely mapped reads and reads with multiple matches that were assigned to an exon-exon junction of this gene.
- Unique intron-exon reads. Reads that uniquely map across an exon-intron boundary. If you have many of these reads, it could indicate that a number of splice variants are not annotated on your reference.
- Total intron-exon reads. Reads that map across an exon-intron boundary. As for the 'Total gene reads' this includes both uniquely mapped reads and reads with multiple matches that were assigned to an exon-intron junction of this gene. If you have many of these reads, it could indicate that a number of splice variants are not annotated on your reference.
- Exons. The number of exons based on the mRNA annotations on the reference. Note that this is not based on the sequencing data - only on the annotations already on the reference sequence(s).
- Putative exons. The number of new exons discovered during the analysis (see more in Exon discovery).
- RPKM. This is the expression value measured in RPKM [Mortazavi et al., 2008]:
 . See exact definition below. Even if you have chosen the RPKM values to be used in the Expression values column, they will also be stored in a separate column. This is useful to store the RPKM if you switch the expression measure. See more in Definition of RPKM.
- Median coverage. This is the median coverage for all exons (for all reads - not only the unique ones). It is calculated by calculating the coverage for each base position in an exon region of the gene, and then taking the median of those values.
- Chromosome region start. Start position of the annotated gene.
- Chromosome region end. End position of the annotated gene.
Double-clicking any of the genes will open the mapping of the reads to the reference (see figure 27.13).
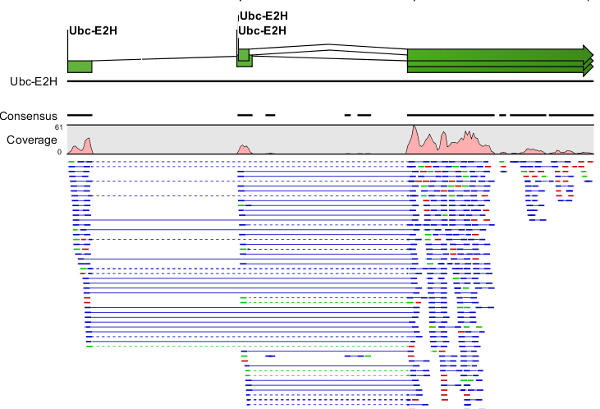
Figure 27.13: Opening the mapping of the reads. Zoomed out to provide a better overview.
Reads spanning two exons are shown with a dashed line between each end as shown in figure 27.13.
At the bottom of the table you can change the expression measure. Simply select another value in the drop-down list. The expression measure chosen here is the one used for further analysis. When setting up an experiment, you can specify an expression value to apply to all samples in the experiment.
The RNA-Seq analysis result now represents the expression values for the sample, and it can be further analyzed using the various tools in the Transcriptomics Analysis toolbox.