File formats
CLC Genomics Workbench supports the following file formats for graphics export:
| Format | Suffix | Type |
|---|---|---|
| Portable Network Graphics | .png | bitmap |
| JPEG | .jpg | bitmap |
| Tagged Image File | .tif | bitmap |
| PostScript | .ps | vector graphics |
| Encapsulated PostScript | .eps | vector graphics |
| Portable Document Format | vector graphics | |
| Scalable Vector Graphics | .svg | vector graphics |
These formats can be divided into bitmap and vector graphics. The difference between these two categories is described below:
Bitmap images
In a bitmap image, each dot in the image has a specified color. This implies, that if you zoom in on the image there will not be enough dots, and if you zoom out there will be too many. In these cases the image viewer has to interpolate the colors to fit what is actually looked at. A bitmap image needs to have a high resolution if you want to zoom in. This format is a good choice for storing images without large shapes (e.g. dot plots). It is also appropriate if you don't have the need for resizing and editing the image after export.
To produce a high resolution image with all the details of a large element visible, e.g. a large phylogenetic tree or a read mapping, we recommend exporting to a vector based format.
If Screen resolution and High resolution settings show the same pixel dimensions, this can be because the maximum supported number of pixels has been exceeded.
Parameters for bitmap formats
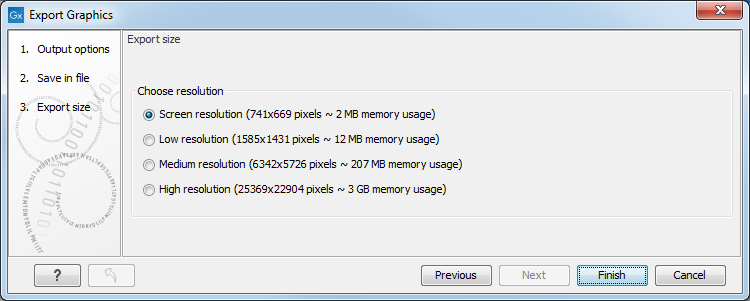
For bitmap files, clicking Next will display the dialog shown in figure 7.40.

Figure 7.40: Parameters for bitmap formats: size of the graphics file.
You can adjust the size (the resolution) of the file to four standard sizes:
- Screen resolution
- Low resolution
- Medium resolution
- High resolution
Vector graphics
Vector graphic is a collection of shapes. Thus what is stored is information about where a line starts and ends, and the color of the line and its width. This enables a given viewer to decide how to draw the line, no matter what the zoom factor is, thereby always giving a correct image. This format is good for graphs and reports, but less usable for dot plots. If the image is to be resized or edited, vector graphics are by far the best format to store graphics. If you open a vector graphics file in an application such as Adobe Illustrator, you will be able to manipulate the image in great detail.
Graphics files can also be imported into the Navigation Area. However, no kinds of graphics files can be displayed in CLC Genomics Workbench. See External files for more about importing external files into CLC Genomics Workbench.
Parameters for vector formats
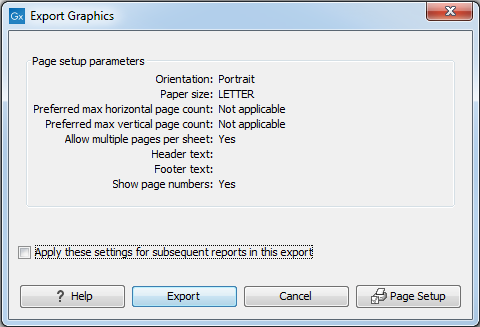
For PDF format, the dialog shown in figure 7.41 will sometimes appear after you have clicked finished (for example when the graphics use more than one page, or there is more than one PDF to export).

Figure 7.41: Page setup parameters for vector formats.
The settings for the page setup are shown. Clicking the Page Setup button will display a dialog where these settings can ba adjusted. This dialog is described in Page Setup.
It is then possible to click the option "Apply these settings for subsequent reports in this export" to apply the chosen settings to all the PDFs included in the export for example.
The page setup is only available if you have selected to export the whole view - if you have chosen to export the visible area only, the graphics file will be on one page with no headers or footers.
Exporting protein reports
It is possible to export a
protein report using the normal Export function (![]() )
which will generate a pdf file with a table of contents:
)
which will generate a pdf file with a table of contents:
Click the report in the Navigation Area | Export (![]() ) in the Toolbar | select pdf
) in the Toolbar | select pdf
You can also choose to export a protein report using the Export
graphics function (![]() ), but in this way you will
not get the table of contents.
), but in this way you will
not get the table of contents.
