The structure scanning result
The output of the analysis are plots of
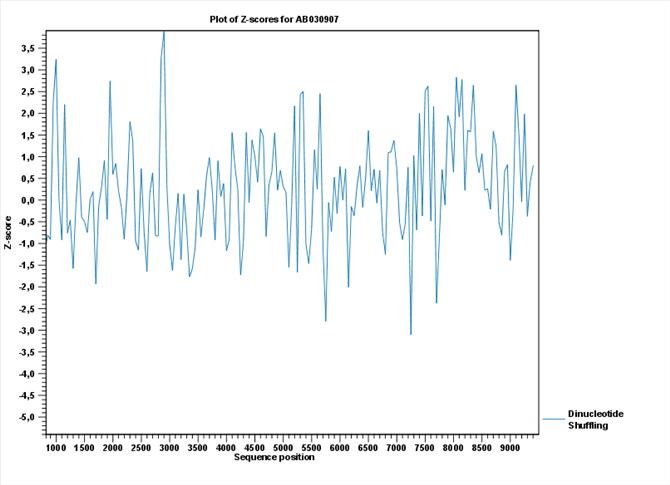
Figure 21.27: A plot of the Z-scores produced by sliding a window along a sequence.
Figure 21.27: A plot of the Z-scores produced by sliding a window along a sequence.