RNA-Seq Analysis tools
Based on an annotated reference genome, the CLC Genomics Workbench supports RNA-Seq Analysis by mapping next-generation sequencing reads and distributing and counting the reads across genes and transcripts. Subsequently, the results can be used for expression analysis. The tools from the RNA-Seq folder automatically account for differences due to sequencing depth, removing the need to normalize input data. The statistical analysis and visualization tools of the RNA-Seq folder make extensive use of the metadata system.
Since the sequencing depth might differ between samples, a per-sample library size normalization must be performed before samples can be compared. In the case of the tools included in the RNA-Seq folder, this normalization is automatically applied by the tools.
All of the tools in the RNA-Seq folder use the TMM (trimmed mean of M values) normalization method [Robinson and Oshlack, 2010] to calculate effective libraries sizes, which are then used as part of the per-sample normalization. TMM normalization is the normalization used in EdgeR [Robinson et al., 2010].
TMM normalization adjusts library sizes based on the assumption that most genes are not differentially expressed. Therefore, it is important not to make subsets of the count data before doing statistical analysis or visualization, as this can lead to differences being normalized away.
For the expression visualization tools (Create Heat Map and PCA for RNA-Seq) additional filtering and normalization are performed:
- 'log CPM' (Counts per Million) values are calculated for each gene. The CPM calculation uses the effective library sizes as calculated by the TMM normalization.
- After this first normalization, a second one is performed across samples for each gene: the counts for each gene are mean centered, and scaled to unit variance.
- Genes or transcripts with zero expression across all samples or invalid values (NaN or +/- Infinity) are removed.
The statistical analysis and visualization tools of the RNA-Seq folder make extensive use of the metadata system. For example, metadata are required when defining the experimental design in the Differential Expression for RNA-Seq tool, and can be used to add extra layers of insight in the Create Heat Map and PCA for RNA-Seq tools.
To get the most out of these tools we recommend that all input expression tracks have associated metadata, as shown in figure 26.1. For information about how to use and setup metadata, please see Metadata.
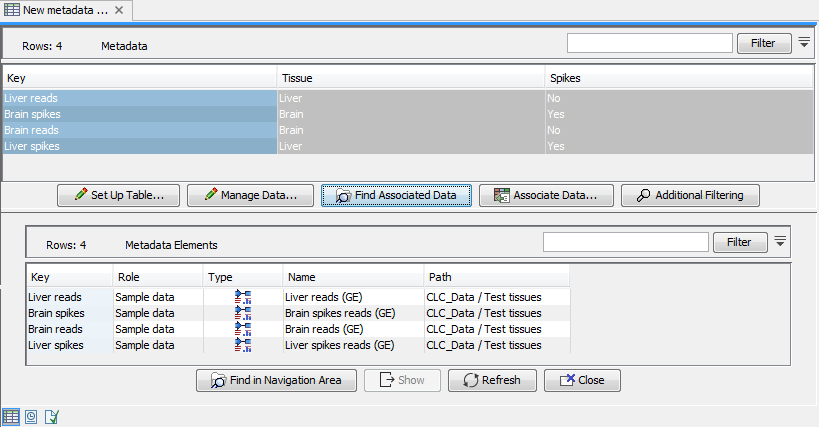
Figure 26.1: An example of expression tracks with associated metadata.
Subsections
- RNA-Seq analysis
- Create Combined RNA-Seq Report
- PCA for RNA-Seq
- Differential Expression for RNA-Seq
- Create Heat Map for RNA-Seq
- Create Expression Browser
- Create Venn Diagram for RNA-Seq
- Gene Set Test