RNA-Seq report
An example of an RNA-seq report generated if you choose the Create report option is shown in figure 26.16.
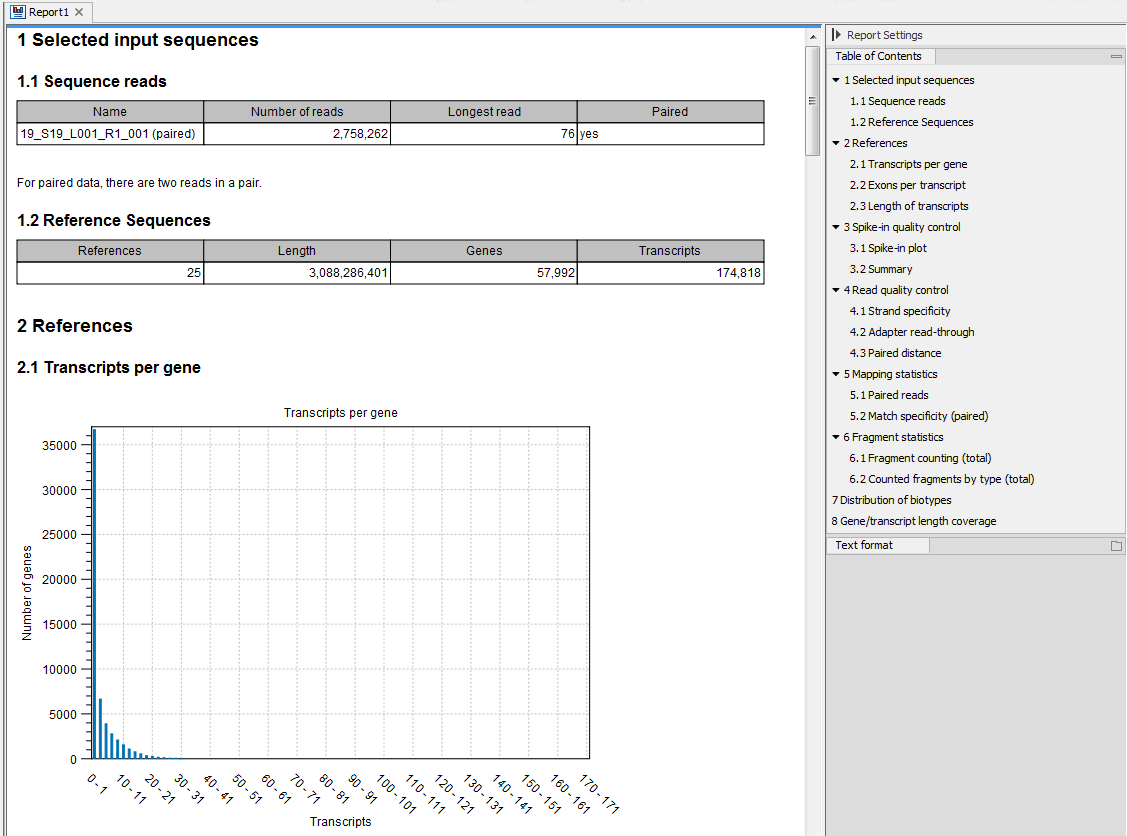
Figure 26.16: Report of an RNA-Seq run.
The report is a collection of the sections described below, some sections included only based on the input provided when starting the tool. If a section is flagged with a pink highlight, it means that something has almost certainly gone wrong in the sample preparation or analysis. A warning message tailored to the highlighted section is added to the report to help troubleshoot the issue. The report can be exported in PDF or Excel format.
Selected input sequences
Information about the sequence reads provided as input, including the number of reads in each sample, as well as information about the reference sequences used and their lengths.
References
Information about the total number of genes and transcripts found in the reference:- Transcripts per gene. A graph showing the number of transcripts per gene.
- Exons per transcript. A graph showing the number of exons per transcript.
- Length of transcripts. A graph showing the distribution of transcript lengths.
Spike-in quality control
- Spike-in plot. A plot shows the expression of each spike-in as a function of the known concentration of that spike-in (see figure 26.17 to see an optimal spike-in plot).
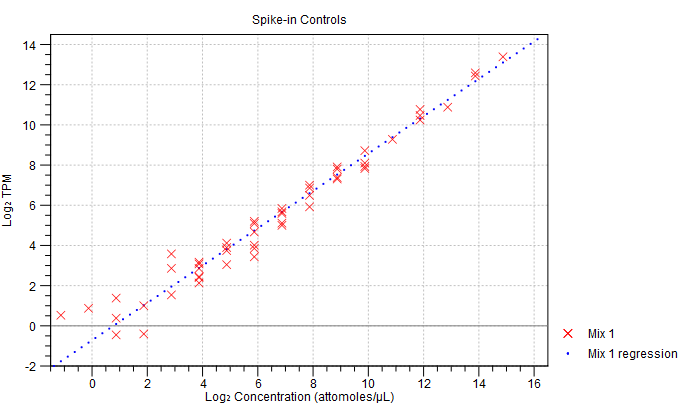
Figure 26.17: Spike-in plot showing how the points fall close to the regression line at high concentration. - Summary table. A table provides more details on the spike-in detection. Figure 26.18 shows a failed spike-in control, with a table where results that require attention are highlighted in pink.
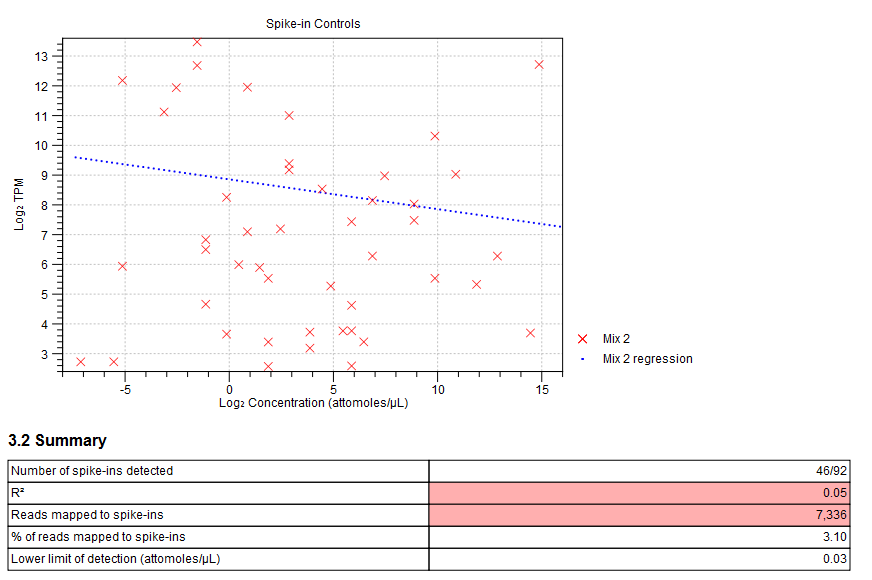
Figure 26.18: Summary table where less than optimal results are highlighted.Under the table, a warning message explains what the optimal value was, and offers some troubleshooting measures: When samples have poor correlation
 between known and measured spike-in concentrations, it indicates problems with the spike-in protocol, or a more serious problem with the sample. To troubleshoot, check that the correct spike-in file has been selected, and control the integrity of the sample RNA.
Also, if fewer than 10000 reads mapped to spike-ins, check that the correct spike-in sequences are specified, and consider using more spike-in mix in future experiments.
between known and measured spike-in concentrations, it indicates problems with the spike-in protocol, or a more serious problem with the sample. To troubleshoot, check that the correct spike-in file has been selected, and control the integrity of the sample RNA.
Also, if fewer than 10000 reads mapped to spike-ins, check that the correct spike-in sequences are specified, and consider using more spike-in mix in future experiments.
Read quality control
This section includes:
- A strand specificity table that indicates the direction of the RNA fragment that generated the read. In a strand-specific protocol almost all reads are generated from
a specific orientation but otherwise, a mix of both orientations is expected.
- A warning message will appear if over 90% of reads were mapped in the same orientation but the tool was run without using a strand specific setting ("Forward"/"Reverse").
- If over 25% of the reads were filtered away due to the strand specific setting, try to re-run the tool with strand specific setting "Both". However, if a strand-specific protocol was used, library preparation may have failed.
- A percentage of mapped paired-end reads containing read-through adapters. If present in above 10% of the reads, adapters may lead to false positive variant calls or incorrect transcript quantification (because reads must align within transcript annotations to be counted towards expression). Read-through adapters can be removed using the Trim Reads tool. Note that single base extensions such as TA overhangs will also be classed as read-through adapters, and in these cases the additional base should also be trimmed. In future experiments, consider selecting fragments that are longer than the read size.
- A paired distance graph (only included if paired reads are used) shows the distribution of paired-end distances, which is equivalent to the distribution of sequenced RNA fragment sizes. There should be a single broad peak at the target fragment size. An asymmetric peak may indicate problems in size selection.
Mapping statistics
Shows statistics on:
- Paired reads or Single reads. The table included depends on the reads used. The table shows the number of reads mapped or unmapped, and in the case of paired reads, how many reads mapped in pairs and in broken pairs.
If over 50% of the reads did not map, and the correct reference genome was selected, this indicates a serious problem with the sample. To troubleshoot, the report offers the following options:
- Check that the correct reference genome and any relevant gene/mRNA tracks have been provided.
- The mapping parameters may be too strict. Try resetting them to the default values.
- Try mapping the un-mapped reads against possible contaminants. If the sample is contaminated, enrich for the target species before library preparation in future experiments.
- Library preparation may have failed. Check the quality of the sample RNA.
In case paired reads are used and over 40% of them mapped as broken pairs, the report hints that there could be problems with the tool settings, a low quality reference sequence, or incomplete gene/mRNA annotations. It could also indicate a more serious problem with the sample. To troubleshoot, it is suggested to:
- Check that the correct reference genome and any relevant gene/mRNA tracks have been provided.
- Try re-running the tool with the "Auto-detect paired distances" option selected.
- Check that the paired-end distances on the reads are set correctly. These are shown in the "Element Information" view on the reads. If these are correct, try re-running the tool without the "Auto-detect paired distances" option.
- Try mapping the reads against possible contaminants. If the sample is contaminated, enrich for the target species before library preparation in future experiments.
- Match specificity. Shows a graph of the number of match positions for the reads. Most reads will be mapped 0 or 1 time, but there will also be reads matching more than once in the reference. The maximum number of match positions is limited in the Maximum number of hits for a read setting in figure 26.4. Note that the number of reads that are mapped 0 times includes both the number of reads that cannot be mapped at all and the number of reads that matches to more than the Maximum number of hits for a read parameter.
Fragment statistics
- Fragment counting. Lists the total number of fragments used for calculating expression, divided into uniquely and non-specifically mapped reads, as well as uncounted fragments (see the point below on match specificity for details).
- Counted fragments by type. Divides the fragments that are counted into different types, e.g., uniquely mapped, non-specifically mapped, mapped. A last column gives the percentage of fragments mapped for a particular type.
- Total gene reads. All reads that map to the gene.
- - Intron. From the total gene reads, reads that fall partly or entirely within an intron.
- - Exon. From the total gene reads, reads that fall entirely within an exon or in an exon-exon junction.
- - - Exon. From the total gene - exon reads, reads that map completely within an exon
- - - Exon-exon. From the total gene - exon reads, reads that map across an exon junction as specified in figure 26.13.
- Intergenic. All reads that map partly or entirely between genes.
- Total. Total amount of reads for a particular type.
Distribution of biotypes
Table generated from biotype annotations present on the input gene or mRNA tracks. If using both gene and mRNA tracks, the biotypes in the report are taken from the mRNA track.- For genes, biotypes can be any of the following columns: "gene_biotype", "biotype", "gbkey", "type". The first one in this list is chosen.
- For transcripts, biotypes can be any of the following columns: "transcript_biotype", "biotype", "gbkey", "type". The first one in this list is chosen.
The biotypes are "as a percentage of all transcripts" or "as a percentage of all genes". For a poly-A enrichment experiment, it is expected that the majority of reads correspond to protein-coding regions. For an rRNA depletion protocol, a variety of non-coding RNA regions may also be observed. The percentage of reads mapping to rRNA should usually be <15%.
If over 15% of the reads mapped to rRNA, it could be that the poly-A enrichment/rRNA depletion protocol failed. The sample can still be used for differential expression and variant calling, but expression values such as TPM and RPKM may not be comparable to those of other samples. To troubleshoot the issues in future experiments, check for rRNA depletion prior to library preparation. Also, if an rRNA depletion kit was used, check that the kit matches the species being studied.
Gene/transcript length coverage
Plot showing the normalized coverage across a gene/transcript body for four different groupings of gene/transcript length (figure 26.19).
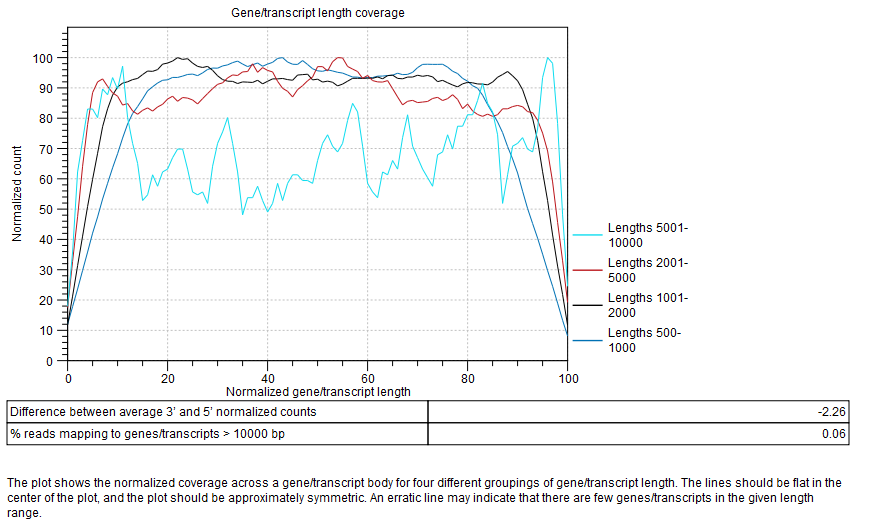
Figure 26.19: Gene/transcript length coverage plot.
The lines should be flat in the center of the plot, and the plot should be approximately symmetric. An erratic line may indicate that there are few genes/transcripts in the given length range. Lines showing normalized count higher on the 3'end indicates the presence of polyA tails in the reads, consequence of degraded RNAs. Future experiments may benefit from using an rRNA depletion protocol.
In the table below the plot, a difference between average 3' and 5' normalized counts higher than 25 warns that variants may not be called in low coverage regions, and that TPM or RPKM values may be unreliable. Most transcripts are <10000 bp long, so a warning is raised if many reads map to features longer than this. One possible cause is that no mRNA track has been provided for an organism with extensive splicing.