Running the Create Statistics for Target Regions
To create the target regions statistics:
Toolbox | Resequencing (![]() ) | Create Statistics for Target Regions (
) | Create Statistics for Target Regions (![]() )
)
This opens a wizard where you can select mapping results (![]() )/ (
)/ (![]() )/ (
)/ (![]() ). Clicking Next will take you to the wizard shown in figure 25.1.
). Clicking Next will take you to the wizard shown in figure 25.1.
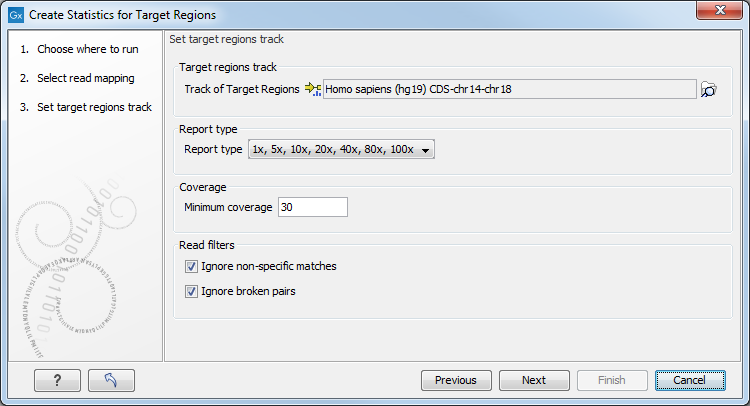
Figure 25.1: Specifying the track of target regions.
Click the Browse (![]() ) icon to select an annotation track that defines the targeted regions of your reference genome.
You can either import the target regions as an annotation file or convert from annotations on a reference genome that is already stored in the Navigation Area.
) icon to select an annotation track that defines the targeted regions of your reference genome.
You can either import the target regions as an annotation file or convert from annotations on a reference genome that is already stored in the Navigation Area.
The Report type allows you to select different sets of predefined coverage thresholds to use for reporting (see below). Furthermore, you will be asked to provide a Minimum coverage threshold, i.e., the minimum coverage needed on all positions in a target, in order for that target to be considered covered.
Finally, you are asked to specify whether you want to Ignore non-specific matches and Ignore broken pairs. When these are applied reads that are non-specifically mapped or belong to broken pairs will be ignored.
Click Next to specify the type of output you want (see figure 25.2).
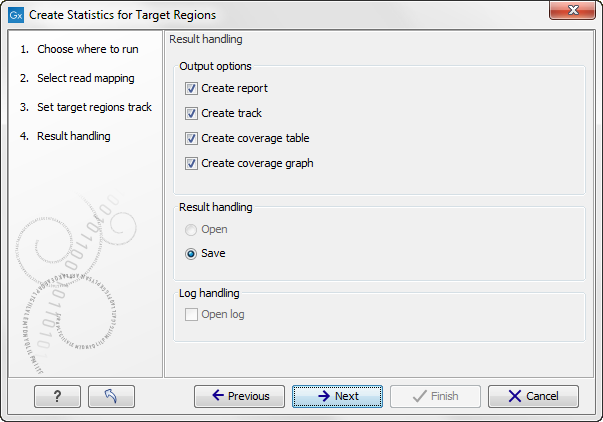
Figure 25.2: Specifying how the result should be reported.
There are three options:
- The report gives an overview of the whole data set as explained in Coverage summary report.
- The track gives information on coverage for each target region as described in Per-region statistics.
- The coverage table outputs coverage for each position in all the targets as described in Coverage table.
- The coverage graph outputs a graphical presentation of the coverage for each position in all the targets. Positions outside the targets will have the value 0. The values are calculated by the "Target regions statistics" tool - that is, where broken pairs and multi-hit reads are included or ignored, depending upon what the user has specified in the wizard. On the x-axis is the reference position; on the y-axis is the coverage. The x-axis and y-axis values are identical to those found in the corresponding columns of the coverage table.