Hypergeometric tests on annotations
The first approach to using annotations to extract biological information is the hypergeometric annotation test. This test measures the extent to which the annotation categories of features in a smaller gene list, 'A', are over or under-represented relative to those of the features in larger gene list 'B', of which 'A' is a sub-list. Gene list B is often the features of the full experiment, possibly with features which are thought to represent only noise, filtered away. Gene list A is a sub-experiment of the full experiment where most features have been filtered away and only those that seem of interest are kept. Typically gene list A will consist of a list of candidate differentially expressed genes. This could be the gene list obtained after carrying out a statistical analysis on the experiment, and choosing to keep only those features with FDR corrected p-values <0.05 and a fold change larger than 2 in absolute value. The hyper geometric test procedure implemented is similar to the unconditional GOstats test of [Falcon and Gentleman, 2007].
Toolbox | Microarray and Small RNA Analysis (![]() )| Annotation Test | Hypergeometric Tests on Annotations (
)| Annotation Test | Hypergeometric Tests on Annotations (![]() )
)
This will show a dialog where you can select the two experiments - the larger experiment, e.g. the original experiment including the full list of features - and a sub-experiment (see how to create a sub-experiment in Creating sub-experiment from selection).
Click Next. This will display the dialog shown in figure 27.78.
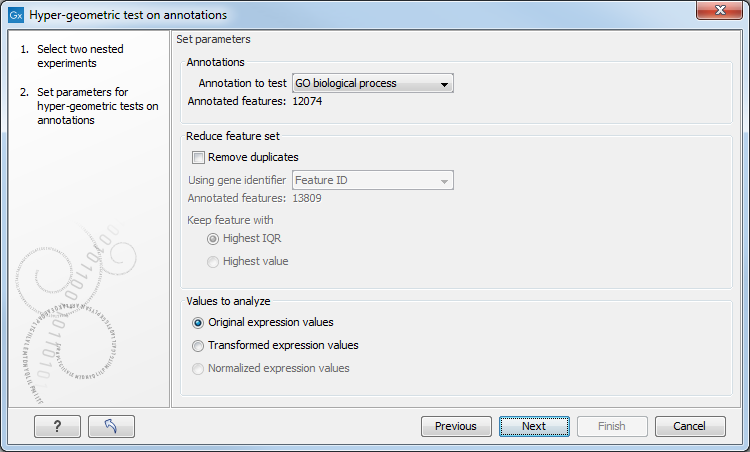
Figure 27.78: Parameters for performing a hypergeometric test on annotations.
At the top, you select which annotation to use for testing. You can select from all the annotations available on the experiment, but it is of course only a few that are biologically relevant. Once you have selected an annotation, you will see the number of features carrying this annotation below.
Annotations are typically given at the gene level. Often a gene is represented by more than one feature in an experiment. If this is not taken into account it may lead to a biased result. The standard way to deal with this is to reduce the set of features considered, so that each gene is represented only once. In the next step, Remove duplicates, you can choose the basis on which the feature set will be reduced:
- Using gene identifier.
- Keep feature with:
- Highest IQR. The feature with the highest interquartile range (IQR) is kept.
- Highest value. The feature with the highest expression value is kept.
At the bottom, you can select which values to analyze (see Selecting transformed and normalized values for analysis). Only features that have a numerical value assigned to them will be used for the analysis. That is, any feature which has a value of plus infinity, minus infinity or NaN will not be included in the feature list taken into the test. Thus, the choice of value at this step can affect the features that are taken forward into the test in two ways:
- If there are features with values of plus infinity, minus infinity or NaN, those features will not be taken forward into the test. This can be a consideration when choosing transformed values, where the mathematical manipulations involved may lead to such values.
- If you chose to remove duplicates, then the value type you choose here is the value used for checking the highest IQR or value to determine which feature is taken forward into the test.
The final number of features used for the test is reported in this history view of the test results.
Click Finish to start the tool.
Subsections