Clustering of features and samples
The hierarchical clustering clusters features by the similarity of their expression profiles over the set of samples. It clusters samples by the similarity of expression patterns over their features.
Each clustering has a tree structure that is generated by
- Letting each feature or sample be a cluster.
- Calculating pairwise distances between all clusters.
- Joining the two closest clusters into one new cluster.
- Iterating 2-3 until there is only one cluster left (which contains all the features or samples).
The tree is drawn so that the distances between clusters are reflected by the lengths of the branches in the tree.
To create a heat map:
Toolbox | RNA-Seq Analysis | Create Heat Map for RNA-Seq (![]() )
)
Select at least two expression tracks (![]() ) and click Next.
) and click Next.
This will display the wizard shown in figure 26.28. The hierarchical clustering algorithm requires that you specify a distance measure and a cluster linkage. The distance measure is used to specify how distances between two features or samples should be calculated. The cluster linkage specifies how the distance between two clusters, each consisting of a number of features or samples, should be calculated.
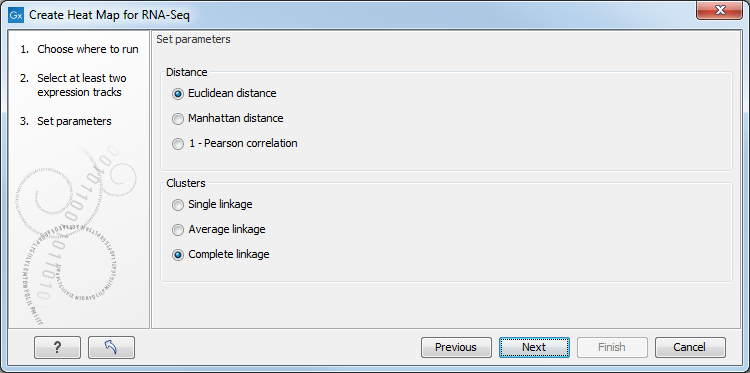
Figure 26.28: Parameters for Create Heat Map.
There are three kinds of Distance measures:
- Euclidean distance The ordinary distance between two points - the length of the segment connecting them. If
 and
and
 ,
then the Euclidean distance between
,
then the Euclidean distance between  and
and  is
is
- Manhattan distance The Manhattan distance between two points is the distance measured along axes at right angles. If
and
,
then the Manhattan distance between and is
- 1 - Pearson correlation The Pearson correlation coefficient between two elements
 and
and
 is defined as
where
is defined as
where
 is the average of values in
  and
and  is the sample standard deviation of these values.
It takes a value
is the sample standard deviation of these values.
It takes a value
![$ \in [-1,1]$](img289.gif) . Highly correlated elements have a high absolute value of the Pearson correlation, and elements whose values are un-informative about each other have Pearson correlation 0. Using
. Highly correlated elements have a high absolute value of the Pearson correlation, and elements whose values are un-informative about each other have Pearson correlation 0. Using
 as distance measure means that elements that are highly correlated will have a short distance between them, and elements that have low correlation will be more distant from each other.
The possible cluster linkages are:
- Single linkage The distance between two clusters is computed as the distance between the two closest elements in the two clusters.
- Average linkage The distance between two clusters is computed as the average distance between objects from the first cluster and
objects from the second cluster. The averaging is performed over all pairs
 , where
  is an object from the first cluster and
  is an object from the second cluster.
- Complete linkage The distance between two clusters is computed as the maximal object-to-object distance
 , where
  comes from the first cluster, and
  comes from the second cluster. In other words, the distance between two clusters is computed as the distance between the two farthest objects in the two clusters.
After having selected the distance measure, click Next to set up the feature filtering options as shown in figure 26.29.
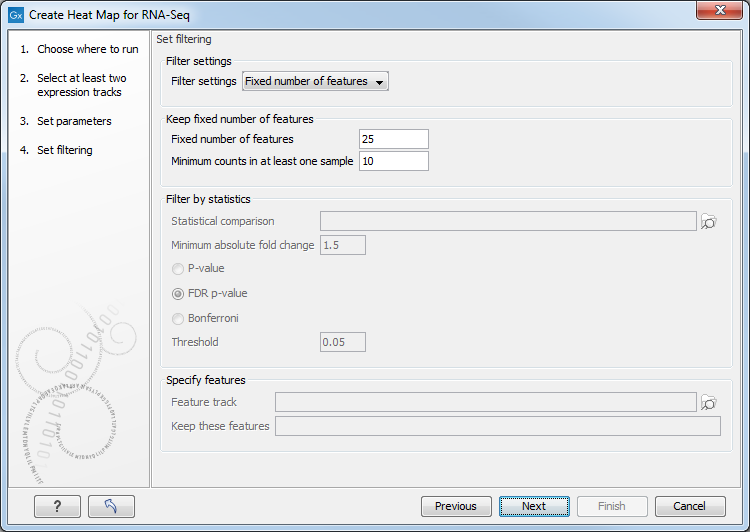
Figure 26.29: Feature filtering for Create Heat Map.
Genomes usually contain too many features to allow for a meaningful visualization of all genes or transcripts. Clustering hundreds of thousands of features is also very time consuming. Therefore it is recommend to reduce the number of features before clustering and visualization.
There are several different Filter settings to filter genes or transcripts:
- No filtering Keeps all features.
- Fixed number of features
- Fixed number of features The given number of features with the highest coefficient of variation (the ratio of the standard deviation to the mean) are kept.
- Minimum counts in at least one sample Only features with more than this number of counts in at least one sample will be taken into account. Notice that the counts are raw, un-normalized values.
- Filter by statistics Keeps features that are differentially expressed according to the specified cut-offs.
- Statistical comparison A single statistical comparison track output by the Differential Expression for RNA-Seq tool.
- Minimum absolute fold change Only features with a higher absolute fold change are kept.
- Threshold Only features with a lower p-value are kept. It is possible to select which type of p-value to use.
- Specify features Keeps a set of features, as specified by either a feature track or by plain text.
- Feature track Any genes or transcripts defined in the feature track will be kept.
- Keep these features A plain text list of feature names. Any white-space characters, and ",", and ";" are accepted as separators.