Mapping paired reads
- Auto-detect paired distances At the bottom of the dialog shown in figure 24.3 you can specify how Paired reads should be handled. You can read more about how paired data is imported and handled in General notes on handling paired data. If the sequence list used as input contains paired reads, this option will automatically be enabled - if it contains single reads, this option will not be applicable.
The CLC Genomics Workbench offers as the default choice to automatically calculate the distance between the pairs. If this is selected, the distance is estimated in the following way:
- A sample of 100,000 reads is extracted randomly from the full data set and mapped against the reference using a very wide distance interval.
- The distribution of distances between the paired reads is analyzed, and an appropriate distance interval is selected:
- If less than 10,000 reads map, a simple calculation is used where the minimum distance is one standard deviation below the average distance, and the maximum distance is one standard deviation above the average distance.
- If more than 10,000 reads map, a more sophisticated method is used which investigates the shape of the distribution and finds the boundaries of the peak.
- The full sample is mapped using this distance interval.
- The history (
 ) of the result records the distance interval used.
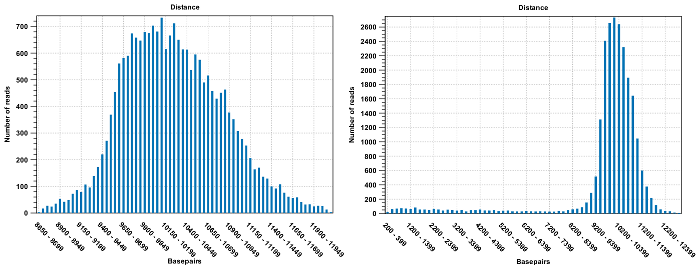
Figure 24.7: To the left: mapping with a narrower distance interval estimated by the workbench. To the right: mapping with a large paired distance interval (note the large right tail of the distribution).
Sometimes the automatic estimation of the distance between the pairs may return a warning "multiple intervals detected". This may happen if the reads derive from multiple libraries or from certain types of amplicon sequencing protocols. In this case, the estimates may still be correct, but, if in doubt, the user may want to disable the option to automatically estimate paired distances and instead manually specify minimum and maximum distances between pairs on the input sequence list.
If the automatic detection of paired distances is not checked, the mapper will use the information about minimum and maximum distance recorded on the input sequence lists (see General notes on handling paired data).
The 'automatic detection of paired distance' option when mapping should be used with caution. It is possible that the estimated distance setting is too narrow and consequently many read pairs will be flagged broken. Sometimes, a second peak in the Paired Distance distribution graph is not picked up on by the estimation tool.
If a large portion of pairs are flagged 'Broken' we recommend the following:
- Inspect the Detailed mapping report to deduce a distance setting interval - and compare this to the estimated distance used by the mapper (found in the mapping history).
- Open the paired reads list and set a broad paired distance in the Elements tab. Then run a new mapping with the 'auto-detect...' OFF. Make sure to have a report produced. Open this report and look at the Paired Distance Distribution graph. This will tell you the distances that your pairs did map with. Use this information to narrow down the distance setting and perhaps run a third mapping using this.
- Another cause of excessive amounts of broken pairs is misspecification of the read pair orientation. This can be changed in the Elements tab of the paired reads list prior to running a mapping.
See Detailed mapping report for further information.
When a paired distance interval is set, the following approach is used for determining the placement of read pairs:
- First, all the optimal placements for the two individual reads are found.
- Then, the allowed placements according to the paired distance interval are found.
- If both reads can be placed independently but no pairs satisfies the paired criteria, the reads are treated as independent and marked as a broken pair.
- If only one pair of placements satisfy the criteria, the reads are placed accordingly and marked as uniquely placed even if either read may have multiple optimal placements.
- If several placements satisfy the paired criteria, the pair is treated as a non-specific match (see General mapping options for more information.)
- If one read is uniquely mapped but the other read has several placements that are valid given the distance interval, the mapper chooses the location that is closest to the first read.