Identify Graph Threshold Areas
The Identify Graph Threshold Areas tool uses graph tracks as input to identify graph regions that fall within certain limits or thresholds. Both a lower and an upper threshold can be specified to create an annotation track for those regions of a graph track where the values are in the given range (see figure 23.31). The range chosen for the lower and upper thresholds will depend on the data (coverage, quality etc).
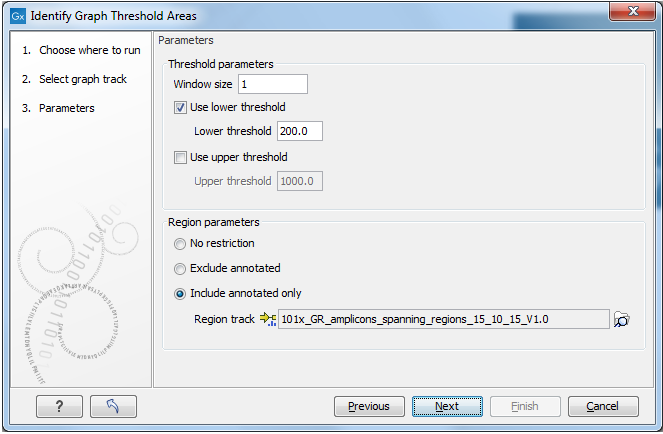
Figure 23.31: Specification of lower and upper thresholds.
The window-size parameter specifies the width of the window around every position that is used to calculate an average value for that position and hence "smoothes" the graph track beforehand. A window size of 1 will simply use the value present at every individual position and determine if it is within the upper and lower threshold, hence resulting in the same "non-smoothing" behavior as previous versions of the workbench without this parameter. In contrast, a window size of 100 checks if the average value derived from the surrounding 100 positions falls between the minimum and maximum threshold. Such larger windows help to prevent "jumps" in the graph track from fragmenting the output intervals or help to detect over-represented regions in the track that are only visible when looked at in the context of larger intervals and lower resolution.
It is also possible to restrict the tool to certain regions.
An example output is shown in figure 23.32 where the coverage graph has a couple of local minima near zero. However, by using the averaging window, the tool is able to produce a single unbroken annotation covering the entire region. Of course larger window sizes result in regions that are broader and hence their boundaries are less likely to exactly coincide with the borders of visually recognizable borders of regions in the track.
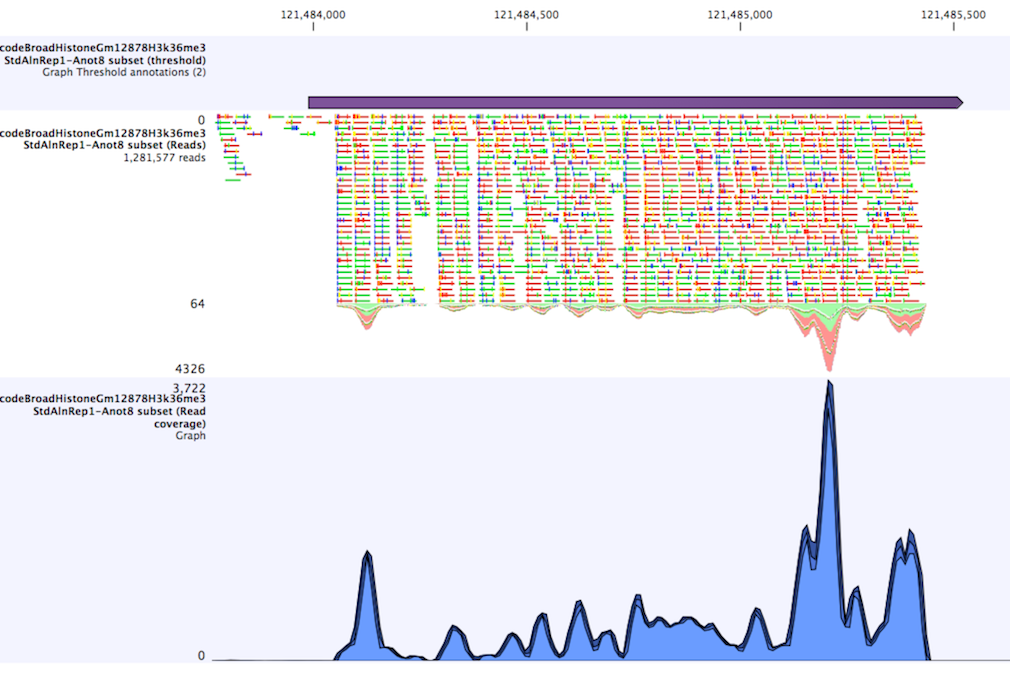
Figure 23.32: Track list including a region identified by the parameters set above on a dataset of H3K36 methylation from ENCODE. The top track shows the resulting region. Below is the track containing the reads. The graph track at the bottom shows the coverage with the minimum, mean, and maximum observed values.
When zoomed out, the graph tracks are composed of three curves showing the maximum, mean, and minimum value observed in a given region (see figure 23.32). When zoomed in all the way down to base resolution only one curve will be shown reflecting the exact observation at each individual position.