Create Venn Diagram for RNA-Seq
The Create Venn Diagram tool makes it possible to compare the overlap of differentially expressed genes or transcripts in two or more statistical comparison tracks. The genes considered to be differentially expressed can be controlled by setting appropriate p-value and fold change thresholds.
To create the Venn diagram:
Toolbox | RNA-Seq Analysis | Create Venn Diagram
Select a number of statistical comparison tracks (![]() ) and click Next (see figure 26.36).
) and click Next (see figure 26.36).
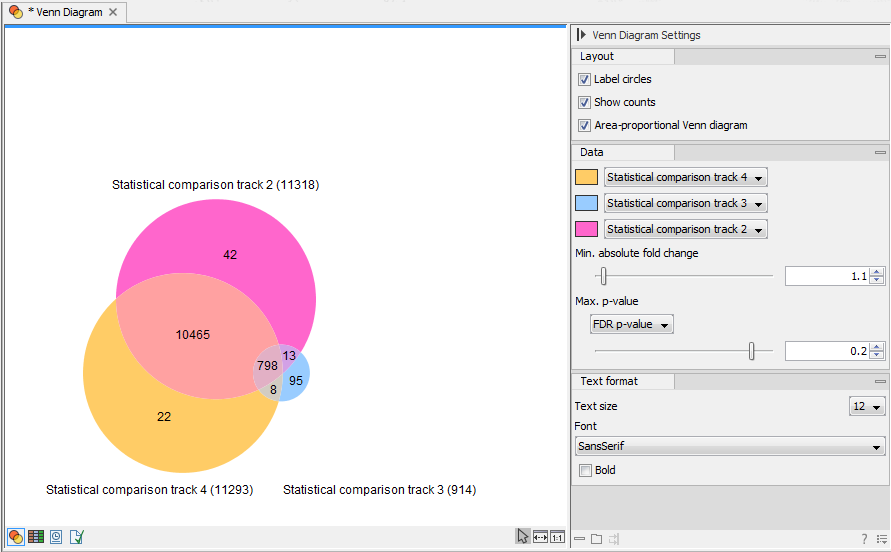
Figure 26.36: The resulting Venn diagram.
In the Side Panel to the right, it is possible to adjust the Venn Diagram settings. Under Layout, you can adjust the general properties of the plot.
- Label circles Toggles the names of the statistical comparison tracks.
- Show counts Toggles the display of gene or transcript counts.
- Area-proportional Venn Diagram When drawn as a Standard Venn Diagram, circles are drawn with fixed positions and identical size. When drawn in the default Venn Diagram mode, sizes and positions of the circles are adjusted in proportion to the number of overlapping features.
The Data side panel group makes it possible to choose the differentially expressed genes or features of interest. The set of statistical comparisons to be compared can be selected using the drop down combo boxes at the top of the group. It is possible to customize the color of a given statistical comparison using the color picker next to the drop down combo box.
- Minimum absolute fold change Only genes or transcripts with an absolute fold change higher than the specified threshold are taken into account.
- Maximum P-value Only genes or transcripts with a p-value less then the specified threshold will be taken into account. It is possible to select which p-value measure to use.
Finally, the Text format group makes it possible to adjust the settings for the count and statistical comparison labels.
Subsections