Normalization
The CLC Genomics Workbench lets you normalize expression values.
To start the normalization:
Toolbox | Microarray and Small RNA Analysis (![]() )| Transformation and Normalization | Normalize (
)| Transformation and Normalization | Normalize (![]() )
)
Select a number of samples ( (![]() ) or (
) or (![]() )) or an experiment (
)) or an experiment (![]() ) and click Next.
) and click Next.
This will display a dialog as shown in figure 27.47.
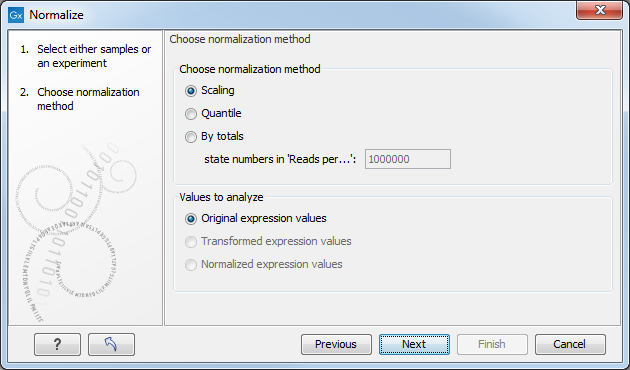
Figure 27.47: Choosing normalization method.
At the top, you can choose three kinds of normalization (for mathematical descriptions see [Bolstad et al., 2003]):
- Scaling. The sets of the expression values for the samples will be multiplied by a constant so that the sets of normalized values for the samples have the same 'target' value (see description of the Normalization value below).
- Quantile. The empirical distributions of the sets of expression values for the samples are used to calculate a common target distribution, which is used to calculate normalized sets of expression values for the samples.
- By totals. This option is intended to be used with count-based data, i.e. data from RNA-seq, small RNA or expression profiling by tags. A sum is calculated for the expression values in a sample. The transformed value are generated by dividing the input values by the sample sum and multiplying by the factor (e.g. per '1,000,000').
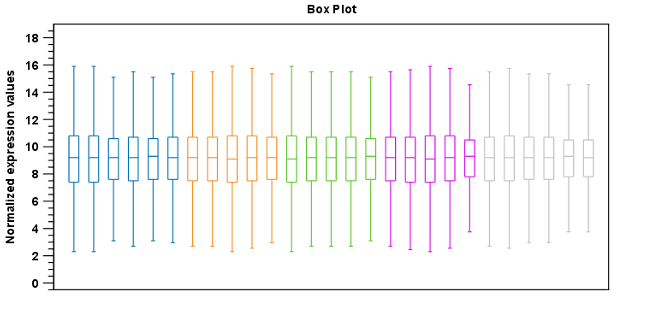
Figure 27.48: Box plot after scaling normalization.
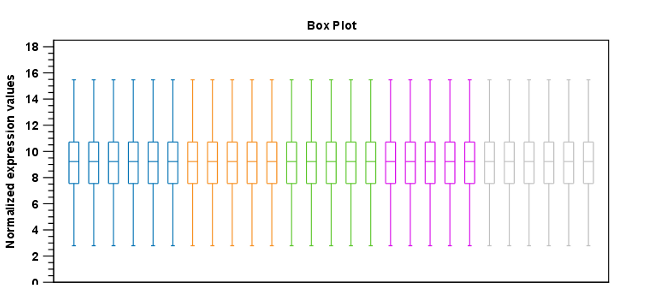
Figure 27.49: Box plot after quantile normalization.
At the bottom of the dialog in figure 27.47, you can select which values to normalize (see Selecting transformed and normalized values for analysis).
Clicking Next will display a dialog as shown in figure 27.50.
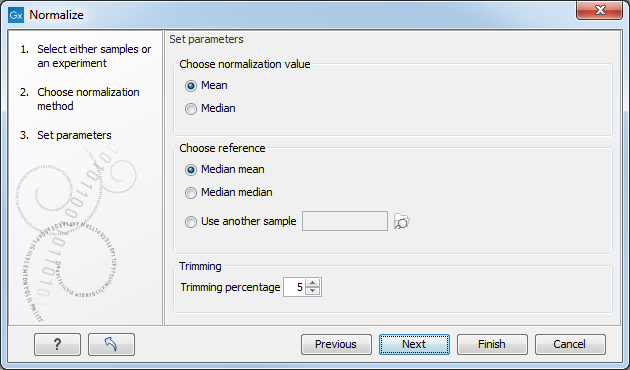
Figure 27.50: Normalization settings.
The following parameters can be set:
- Normalization value. The type of value of the samples which you want to ensure are equal for the normalized expression values
- Mean.
- Median.
- Reference. The specific value that you want the normalized value to be after normalization.
- Median mean.
- Median median.
- Use another sample.
- Trimming percentage. Expression values that lie below the value of this percentile, or above 100 minus the value of this percentile, in the empirical distribution of the expression values in a sample will be excluded when calculating the normalization and reference values.
Click Finish to start the tool.